Unlock a world of possibilities! Login now and discover the exclusive benefits awaiting you.
- Qlik Community
- :
- All Forums
- :
- QlikView App Dev
- :
- Is there any specific way to get color shading in ...
- Subscribe to RSS Feed
- Mark Topic as New
- Mark Topic as Read
- Float this Topic for Current User
- Bookmark
- Subscribe
- Mute
- Printer Friendly Page
- Mark as New
- Bookmark
- Subscribe
- Mute
- Subscribe to RSS Feed
- Permalink
- Report Inappropriate Content
Is there any specific way to get color shading in qlikview ?
Hi All ,
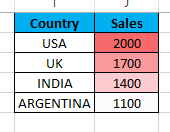
In excel using conditional we can get color shading from light faint to deep based on values of a field .Example : Sales
Can this be achieved in Qlikview ? And how ?
Thanks
Shekar
Accepted Solutions
- Mark as New
- Bookmark
- Subscribe
- Mute
- Subscribe to RSS Feed
- Permalink
- Report Inappropriate Content
Or may be like:
background color : RGB(255-RowNo()*10,100-RowNo()*1, 150-RowNo()*1)
You can play with different color combinations similarly. RowNo() would give you the color shading.
- Mark as New
- Bookmark
- Subscribe
- Mute
- Subscribe to RSS Feed
- Permalink
- Report Inappropriate Content
You may try this?
- Mark as New
- Bookmark
- Subscribe
- Mute
- Subscribe to RSS Feed
- Permalink
- Report Inappropriate Content
You need to graduate the background colours for the expressions. The ColorMix functions will return a graduated colour based on an expression value and limit colours. The easiest way is to use the ColorMix Wizard on the Expression editor menu which will help you create a ColorMix function step by step.
- Mark as New
- Bookmark
- Subscribe
- Mute
- Subscribe to RSS Feed
- Permalink
- Report Inappropriate Content
Hi Anil ,
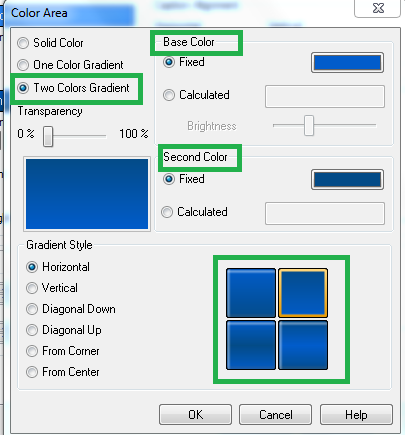
Thanks for reply . I see that i already have same setting in color area .
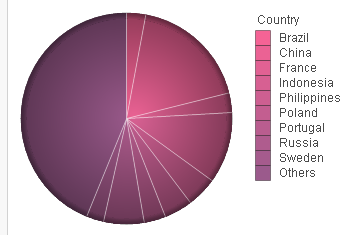
I am attaching sample qvw . Can you please help me in replicating similar color shading for the pie chart in there .
Regards
Shekar
- Mark as New
- Bookmark
- Subscribe
- Mute
- Subscribe to RSS Feed
- Permalink
- Report Inappropriate Content
Put simply:
=ColorMix1(expr, Red(), Green())
Expr returns a value from 0 to 1. Red() is the colour at 0, Green the colour at 1
=ColorMix2(expr, Red(), Yellow(), Green)
Expr returns a value from -1 to 1. Redis for -1, Yellow for 0 and Green for 1.
- Mark as New
- Bookmark
- Subscribe
- Mute
- Subscribe to RSS Feed
- Permalink
- Report Inappropriate Content
Please find attached qvw
- Mark as New
- Bookmark
- Subscribe
- Mute
- Subscribe to RSS Feed
- Permalink
- Report Inappropriate Content
Thanks for the reply .
Please replicate same in pie chart attached
- Mark as New
- Bookmark
- Subscribe
- Mute
- Subscribe to RSS Feed
- Permalink
- Report Inappropriate Content
Or may be like:
background color : RGB(255-RowNo()*10,100-RowNo()*1, 150-RowNo()*1)
You can play with different color combinations similarly. RowNo() would give you the color shading.
- Mark as New
- Bookmark
- Subscribe
- Mute
- Subscribe to RSS Feed
- Permalink
- Report Inappropriate Content
Any better way stalwar1 , can you also suggest something on this?