Unlock a world of possibilities! Login now and discover the exclusive benefits awaiting you.
- Qlik Community
- :
- All Forums
- :
- QlikView App Dev
- :
- Label on Grid charts
- Subscribe to RSS Feed
- Mark Topic as New
- Mark Topic as Read
- Float this Topic for Current User
- Bookmark
- Subscribe
- Mute
- Printer Friendly Page
- Mark as New
- Bookmark
- Subscribe
- Mute
- Subscribe to RSS Feed
- Permalink
- Report Inappropriate Content
Label on Grid charts
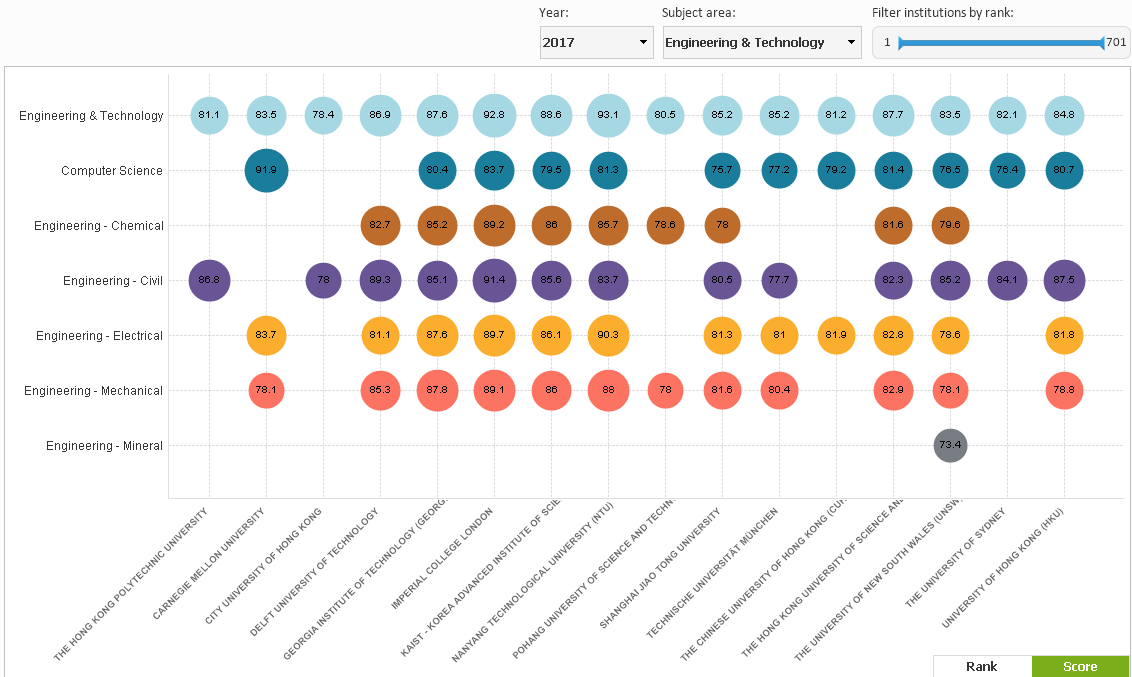
Hoping someone here can help; I have a Grid chart as shown on the attached screenshot, and I want to show the value on the bubbles. I know that by default Qlikview doesn't support "Value on Datapoints" in the Expression level, so I added the following "dual(aggr(SubjectScore,Institution,Subject),Subject)" as a third dimension and enabled "Label on Datapoints" under Presentation. Depending on my selection in the Institution, this seems to work sometimes. If I narrow my selection of the Institutions, the values displayed on the datapoints are correct, but when I widen my institution selections, the values displayed on the datapoints are incorrect, sometimes even missing the labels for some data points. The weird thing about this is that when I move my mouse over to the dots, I can see that dual(aggr(SubjectScore,Institution,Subject),Subject) is calculating the correct value on the pop up labels 100% of the time. For some reason the labels on the datapoints are inconsistent with the value shown on Pop-up labels. Would greatly appreciate if someone can help on this issue as I've spent hours trying to figure this out!
Dimension 1: =If(Len(if(Aggr(Max(Ranking_lower),Institution)>=vMinRank and Aggr(Min(Ranking_lower),Institution)<=vMaxRank,Institution)) > 20, Left(if(Aggr(Max(Ranking_lower),Institution)>=vMinRank and Aggr(Min(Ranking_lower),Institution)<=vMaxRank,Institution),FindOneOf(if(Aggr(Max(Ranking_lower),Institution)>=vMinRank and Aggr(Min(Ranking_lower),Institution)<=vMaxRank,Institution),' ',5)-1) & Chr(13) & Mid(if(Aggr(Max(Ranking_lower),Institution)>=vMinRank and Aggr(Min(Ranking_lower),Institution)<=vMaxRank,Institution),FindOneOf(if(Aggr(Max(Ranking_lower),Institution)>=vMinRank and Aggr(Min(Ranking_lower),Institution)<=vMaxRank,Institution),' ',5)+1))
Dimension 2: Subject
Dimension 3:
=dual(aggr(SubjectScore,Institution,Subject),Subject)
Expression: SubjectScore
- « Previous Replies
-
- 1
- 2
- Next Replies »
- Mark as New
- Bookmark
- Subscribe
- Mute
- Subscribe to RSS Feed
- Permalink
- Report Inappropriate Content
Well,
What is the reason of this If(Len(if(Aggr(... ?
I see string functions : so you may use these in script.
I see if functions with vMinRank etc. : so you may use set analysis expressions. As sum({<DimensionToFilterOnFollowingCondition={"=OtherMeasure>ValueInVariable"}>}MeasureField)
But I am not sure it will be anough
- Mark as New
- Bookmark
- Subscribe
- Mute
- Subscribe to RSS Feed
- Permalink
- Report Inappropriate Content

I have a slider object top right to allow users to refine the list of institutions based on their overall rank.
The reason I used the If... for Dimension 1 is to keep that filtering, and also to add a new line character to the X-axis labels
- Mark as New
- Bookmark
- Subscribe
- Mute
- Subscribe to RSS Feed
- Permalink
- Report Inappropriate Content
let's do it step by step, (we should not worry about the string functions for now)
First, filter on [Institution] with a set analysis expression :
dim1 = [Institution] (no left and len functions for now)
dim2 = [Subject}
dim3 = dual(aggr(SeeMeasure,Institution,Subject),Subject)
Measure = assuming it was ==> sum(Measure)
It should now be ==> sum({<Institution={"=Max(Ranking_lower)>=vMinRank"}>*<Institution={"=Min(Ranking_lower)<=vMaxRank"}>}Measure)
- Mark as New
- Bookmark
- Subscribe
- Mute
- Subscribe to RSS Feed
- Permalink
- Report Inappropriate Content
Hi Thomas, I did exactly as you suggested and find that if I change the vMinRank and vMaxRank with the slider, it still messes up the data labels.
- Mark as New
- Bookmark
- Subscribe
- Mute
- Subscribe to RSS Feed
- Permalink
- Report Inappropriate Content
Is there anyway I can use the dual(aggr(SubjectScore,Institution,Subject),Subject) method for labeling while Dimension 1 and Dimension 2 are calculated dimensions?
- Mark as New
- Bookmark
- Subscribe
- Mute
- Subscribe to RSS Feed
- Permalink
- Report Inappropriate Content
Hi Vincent,
I lack of ideas...
What happens whith the Dim3 as =text(Non-aggr-measure) ?
Could you please copy/paste all dimensions and expressions to be sure ?
And maybe if you can share some sample data/data model ?
I could try something later today or tomorrow.
- Mark as New
- Bookmark
- Subscribe
- Mute
- Subscribe to RSS Feed
- Permalink
- Report Inappropriate Content
Hi Vincent,
I'm developing Grid Chart for my requirement wondering how you were able to get angled labels for the institution? If you will guide or provide input on it will be great help.
Thanks,
Vijay
- Mark as New
- Bookmark
- Subscribe
- Mute
- Subscribe to RSS Feed
- Permalink
- Report Inappropriate Content
Hi Vincent,
I figured it out. I had to switch to bar chart to access dimension axis properties and then switch it to grid chart and it retains settings.
Thanks,
Vijay
- Mark as New
- Bookmark
- Subscribe
- Mute
- Subscribe to RSS Feed
- Permalink
- Report Inappropriate Content
Is this possible to get values in Qlik Sense Grid Chart Extension?
- « Previous Replies
-
- 1
- 2
- Next Replies »