Unlock a world of possibilities! Login now and discover the exclusive benefits awaiting you.
- Qlik Community
- :
- All Forums
- :
- QlikView App Dev
- :
- Re: Last 7 Days
- Subscribe to RSS Feed
- Mark Topic as New
- Mark Topic as Read
- Float this Topic for Current User
- Bookmark
- Subscribe
- Mute
- Printer Friendly Page
- Mark as New
- Bookmark
- Subscribe
- Mute
- Subscribe to RSS Feed
- Permalink
- Report Inappropriate Content
Last 7 Days
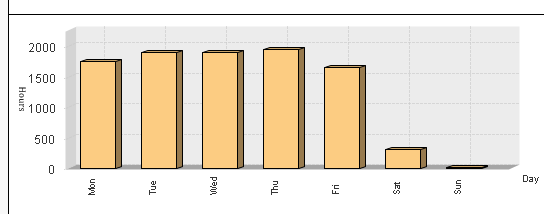
I have a script that shows hours and an EndDate column. I need to show a graph with dimension weekday (Mon,tues, wed, etc..) with an expression showing the hours of the last week I just uploaded.
I am unable to find an dynamic expression that will only show the hours for the days of the last week i uploaded. Need the expression to read the last week (EndDate) i uploaded without me selecting a date. Please help.
- « Previous Replies
-
- 1
- 2
- Next Replies »
Accepted Solutions
- Mark as New
- Bookmark
- Subscribe
- Mute
- Subscribe to RSS Feed
- Permalink
- Report Inappropriate Content
Easiest way is in the script, you need to add a column that is the same value for everyday in the week.
Something like
date(floor(WeekEnd(EndDate))) as WeekendDate
then you can do
sum({<WeekendDate={'$(=max(WeekendDate))'}>}Hours)
- Mark as New
- Bookmark
- Subscribe
- Mute
- Subscribe to RSS Feed
- Permalink
- Report Inappropriate Content
When you load data find the max value for EndDate then compute (into a variable 7 days before)
Use the variable in your dimension into the graph.
- Mark as New
- Bookmark
- Subscribe
- Mute
- Subscribe to RSS Feed
- Permalink
- Report Inappropriate Content
I cant figure out a correct variable to use. Any Suggestions?
- Mark as New
- Bookmark
- Subscribe
- Mute
- Subscribe to RSS Feed
- Permalink
- Report Inappropriate Content
For instance:
MyTab:
Select Max(EndDate) as maxi, Num(Max(EndDate)-7 as Maxi7 From ....
LET vMaxi7 = peek('Maxi7,0,'MyTab');
Then use Maxi7 in your Graph
- Mark as New
- Bookmark
- Subscribe
- Mute
- Subscribe to RSS Feed
- Permalink
- Report Inappropriate Content
Is there a way to have a calculated dimension?
=aggr($(maxi7), WeekDay)
- Mark as New
- Bookmark
- Subscribe
- Mute
- Subscribe to RSS Feed
- Permalink
- Report Inappropriate Content
Then my expression would be sum(hours)
- Mark as New
- Bookmark
- Subscribe
- Mute
- Subscribe to RSS Feed
- Permalink
- Report Inappropriate Content
Assuming EndDate is a weekend date or something unique for each week.
sum({<EndDate={'$(=max(EndDate))'}>}Hours)
- Mark as New
- Bookmark
- Subscribe
- Mute
- Subscribe to RSS Feed
- Permalink
- Report Inappropriate Content
The expression only shows me sunday data. My dimension is Weekday. Any way to show the data for the whole week. Hours is uploaded daily named EndDate.
- Mark as New
- Bookmark
- Subscribe
- Mute
- Subscribe to RSS Feed
- Permalink
- Report Inappropriate Content
I am trying expression =if(EndDate >= (max(EndDate)-7) and EndDate < max(EndDate), Hours) but there is no data to display
- Mark as New
- Bookmark
- Subscribe
- Mute
- Subscribe to RSS Feed
- Permalink
- Report Inappropriate Content
Easiest way is in the script, you need to add a column that is the same value for everyday in the week.
Something like
date(floor(WeekEnd(EndDate))) as WeekendDate
then you can do
sum({<WeekendDate={'$(=max(WeekendDate))'}>}Hours)
- « Previous Replies
-
- 1
- 2
- Next Replies »