Unlock a world of possibilities! Login now and discover the exclusive benefits awaiting you.
- Qlik Community
- :
- All Forums
- :
- QlikView App Dev
- :
- Legends not being shown in line chart
- Subscribe to RSS Feed
- Mark Topic as New
- Mark Topic as Read
- Float this Topic for Current User
- Bookmark
- Subscribe
- Mute
- Printer Friendly Page
- Mark as New
- Bookmark
- Subscribe
- Mute
- Subscribe to RSS Feed
- Permalink
- Report Inappropriate Content
Legends not being shown in line chart
I have a line chart contained within a container. I have two expressions. I have assigned a custom color to each expression. Lines are displayed correctly in the chart. In expressions tab I have option "expression as legend" checked for both expressions but legends are not being displayed.
Accepted Solutions
- Mark as New
- Bookmark
- Subscribe
- Mute
- Subscribe to RSS Feed
- Permalink
- Report Inappropriate Content
goto your Chart and press Strg+Shift
you will see boxes surrounded by red lines
move these boxes (especialy the box which seems to be empty - that one of expressions)
and try to move, Change size
maybe you thelegend is outside of visible area
- Mark as New
- Bookmark
- Subscribe
- Mute
- Subscribe to RSS Feed
- Permalink
- Report Inappropriate Content
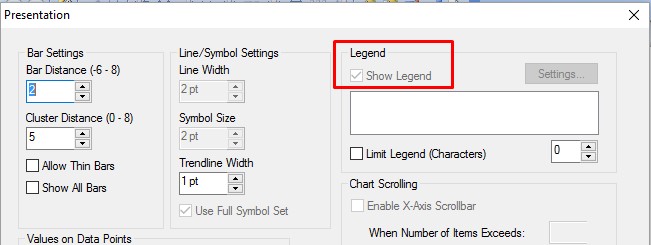
Check if this tick is on:

- Mark as New
- Bookmark
- Subscribe
- Mute
- Subscribe to RSS Feed
- Permalink
- Report Inappropriate Content
goto your Chart and press Strg+Shift
you will see boxes surrounded by red lines
move these boxes (especialy the box which seems to be empty - that one of expressions)
and try to move, Change size
maybe you thelegend is outside of visible area
- Mark as New
- Bookmark
- Subscribe
- Mute
- Subscribe to RSS Feed
- Permalink
- Report Inappropriate Content
Yes, it is checked.
- Mark as New
- Bookmark
- Subscribe
- Mute
- Subscribe to RSS Feed
- Permalink
- Report Inappropriate Content
Yes, this was the problem, legend was outside. I have changed size, but my legends appears vertical and I want to be horizontal. I solved this by moving, resizing and finally legend was put horizontal automatically. Thanks.
- Mark as New
- Bookmark
- Subscribe
- Mute
- Subscribe to RSS Feed
- Permalink
- Report Inappropriate Content
One other possibility: If you have your monitor set to a low DPI and your browser (For Qlik Sense) is zoomed in, it won't show the legend unless you zoom your browser out a great deal.