Unlock a world of possibilities! Login now and discover the exclusive benefits awaiting you.
- Qlik Community
- :
- All Forums
- :
- QlikView App Dev
- :
- Re: Limit values from a graph
- Subscribe to RSS Feed
- Mark Topic as New
- Mark Topic as Read
- Float this Topic for Current User
- Bookmark
- Subscribe
- Mute
- Printer Friendly Page
- Mark as New
- Bookmark
- Subscribe
- Mute
- Subscribe to RSS Feed
- Permalink
- Report Inappropriate Content
Limit values from a graph
Hi
I have a graph and i wanna limit the values to the top 5 or top 7 or the 'x' value that i wanna see
i did an inline table like this
VALOR_LIMITE:
LOAD * INLINE [
VALOR_LIMITE,
5,
8,
12,
15
];
and in the dimension limits i use this field, but it isn´t working
what do you suggest?
Regards
- Tags:
- new_to_qlikview
- Mark as New
- Bookmark
- Subscribe
- Mute
- Subscribe to RSS Feed
- Permalink
- Report Inappropriate Content
You can try Jagan's suggestion
Else
Create a variable and take it in input box
and set it into Presentation tab under when ITem exceed scroll bar...Top right midle..
PFA..
their are two values of dimension only..
- Mark as New
- Bookmark
- Subscribe
- Mute
- Subscribe to RSS Feed
- Permalink
- Report Inappropriate Content
Sorry, should have specified to leave out the quotes. Put everything between the quotes into the field.
You can use in conjunction with a cyclic group. Make sure that you cyclic group replaces the existing dimension in the dimension tab and in the dimension limits tab.
- Mark as New
- Bookmark
- Subscribe
- Mute
- Subscribe to RSS Feed
- Permalink
- Report Inappropriate Content
Hi!
thank you for the help
But i realized i need one more thing
In the dimmensions i have another dimension: Month Year so i'm seeing the top 5 of each month.
How can i see the top 5 or 10 or whatever for all the months?
Regards
- Mark as New
- Bookmark
- Subscribe
- Mute
- Subscribe to RSS Feed
- Permalink
- Report Inappropriate Content
Hi,
Atttach some sample file so that it would be easier to understand.
Regards,
jagan.
- Mark as New
- Bookmark
- Subscribe
- Mute
- Subscribe to RSS Feed
- Permalink
- Report Inappropriate Content
if you have similar kind of dimension like you said, Year & Month..
then make a Drill group of these dimension, it will work into same way
- Mark as New
- Bookmark
- Subscribe
- Mute
- Subscribe to RSS Feed
- Permalink
- Report Inappropriate Content
Hey!
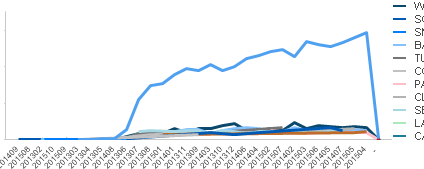
I need a graph like this

now i'm using a top 5. But how i said it isn't working
Thank you
- Mark as New
- Bookmark
- Subscribe
- Mute
- Subscribe to RSS Feed
- Permalink
- Report Inappropriate Content
Hey. It's not easy to attach the qvw right now. But this is the graphic.

now i'm using a top 5. But how i said it isn't working because i see the top 5 of each year month or something like that. I´m not sure but i suppose that
Thank you
- Mark as New
- Bookmark
- Subscribe
- Mute
- Subscribe to RSS Feed
- Permalink
- Report Inappropriate Content
Hi!
thank you for the help
But i realized i need one more thing
In the dimmensions i have another dimension: Month Year so i'm seeing the top 5 of each month.
How can i see the top 5 or 10 or whatever for all the months?
Its this graphic
Regards
- Mark as New
- Bookmark
- Subscribe
- Mute
- Subscribe to RSS Feed
- Permalink
- Report Inappropriate Content
Hi,
Please see the attachment