Unlock a world of possibilities! Login now and discover the exclusive benefits awaiting you.
- Qlik Community
- :
- All Forums
- :
- QlikView App Dev
- :
- Re: Line chart Multiple expressions and One line
- Subscribe to RSS Feed
- Mark Topic as New
- Mark Topic as Read
- Float this Topic for Current User
- Bookmark
- Subscribe
- Mute
- Printer Friendly Page
- Mark as New
- Bookmark
- Subscribe
- Mute
- Subscribe to RSS Feed
- Permalink
- Report Inappropriate Content
Line chart Multiple expressions and One line
Hello,
Is it possible to have in a line chart multiple expressions , one dimension in one line.
Expressions are ( sales N-3 ,sales N-2, sales N-1, budget N, sales N), dimension Year
please see the screenshot to better understand my needs
Thank You.
- « Previous Replies
- Next Replies »
Accepted Solutions
- Mark as New
- Bookmark
- Subscribe
- Mute
- Subscribe to RSS Feed
- Permalink
- Report Inappropriate Content
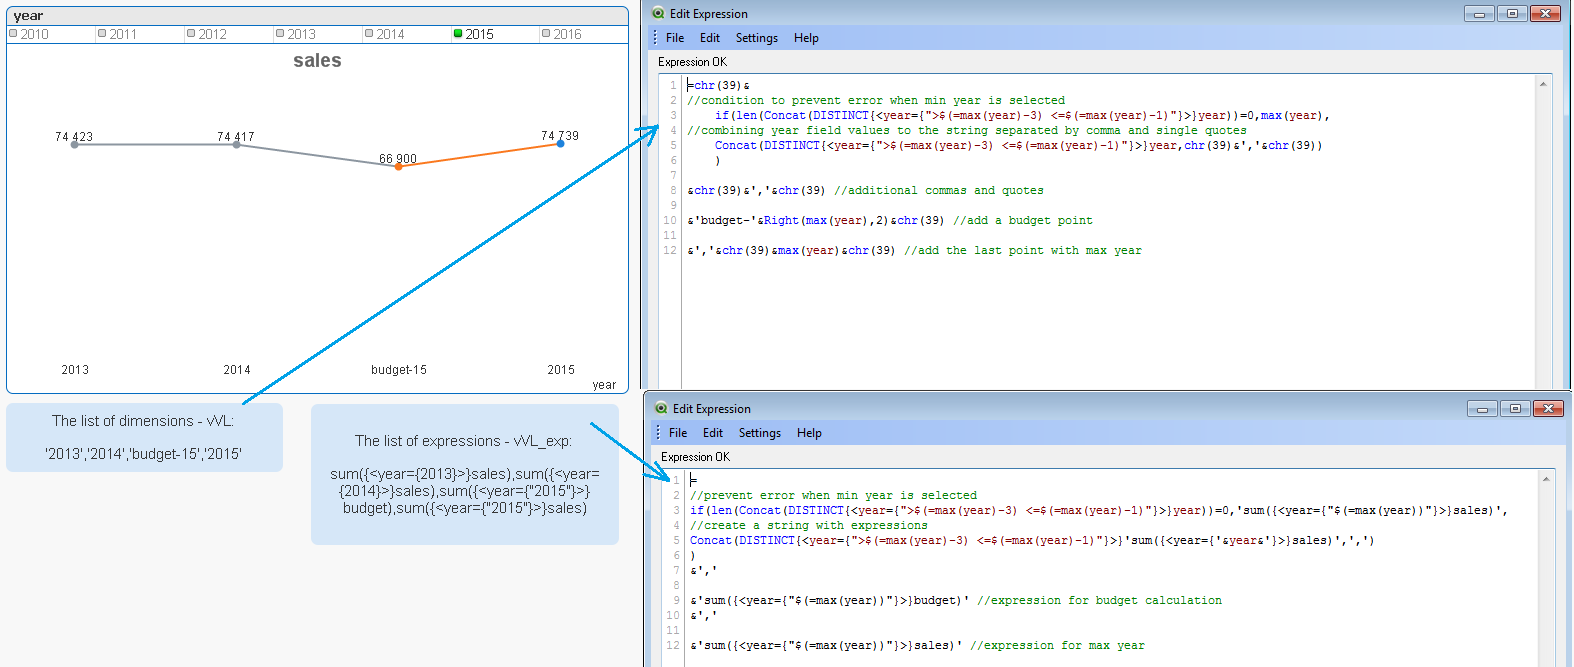
You set four expressions and the chart is returning four dots. There is a little more different way to achieve this.
Please check the picture below and the attachement.
I think you can implement this solution to your project just with renamed fields.

Hope it will help!
- Mark as New
- Bookmark
- Subscribe
- Mute
- Subscribe to RSS Feed
- Permalink
- Report Inappropriate Content
Hello!
For such charts you can use ValueList() function for defining different dimensions.
So, when you select Line Chart go to the dimensions tab, click on Add Calcalated Dimension and write the followin:
ValueList('2010', '2011', '2012', '2013b', '2013')
As Expression you should use such syntaxis:
if(ValueList('2010', '2011', '2012', '2013b', '2013')='2010', sum({<year={2010}>}sales),
if(ValueList('2010', '2011', '2012', '2013b', '2013')='2011', sum({<year={2011}>}sales),
and so on
After that you can copy this value, make another one with dots (instead of lines) and change sum() function to some relative calculations.
- Mark as New
- Bookmark
- Subscribe
- Mute
- Subscribe to RSS Feed
- Permalink
- Report Inappropriate Content
thank you so much for answring quickly.
The solution you gave me suppose that the chart is fixe, i mean im going to have always the same years, however the final user want it to be dynamic , if he select year 2016 , the year N-1 going to be 2015 , the year N-2= 2014 and so on. so the result depends on the year selected. i think i need to use set analysis with year = max(year).
but it doesn't gave me the view i want.
Thank you so much.
- Mark as New
- Bookmark
- Subscribe
- Mute
- Subscribe to RSS Feed
- Permalink
- Report Inappropriate Content
Hm, in that conditions you can do a little trick.
The ValueList() function can be used with dynamic generated list of values.
You should use Concat() function to reach this, but first let take a look at this table:
load * inline
[year, val
2011,20
2012,15
2013,13
2014,7
2015,18];
It's little different from yours but it's made just for good explanation.
Now, if you use this construction as variable:
=chr(39)&concat({<year={">$(=max(year)-3)"}>}year,chr(39)&','&chr(39))&chr(39)
Call this variable vVL. It will return the list of year depending on User's selection.
After that we can use not just ValueList(2011, 2012...) but ValueList($(vVL))
And expression will be:
pick(match(ValueList($(vVL)),$(vVL)), sum({<condition for year - 3>}sales), sum({<condition for year - 2>}sales), sum({<condition for year - 1>}sales) and so on)
It's little complicate, but more flexible, because you can made different calculations in the front-end.
If you wish I can prepare some example (for now I don't have such opportunity - locating on workplace).
- Mark as New
- Bookmark
- Subscribe
- Mute
- Subscribe to RSS Feed
- Permalink
- Report Inappropriate Content
thank you so much for your help.
i will try that method, if i fail in getting the result, i will ask you for a qvw example if its possible.
thank you so much for all your answers.
- Mark as New
- Bookmark
- Subscribe
- Mute
- Subscribe to RSS Feed
- Permalink
- Report Inappropriate Content
Glad to help 😃
Found a little mistake. The vVL expression should be like
=chr(39)&concat({<year={">$(=max(year)-3) <=$(=max(year))"}>}year,chr(39)&','&chr(39))&chr(39)
to make list of three values (in previous expression returns only one - which was selected)
- Mark as New
- Bookmark
- Subscribe
- Mute
- Subscribe to RSS Feed
- Permalink
- Report Inappropriate Content
Found a way to bring you a little example. Hope it will help!
- Mark as New
- Bookmark
- Subscribe
- Mute
- Subscribe to RSS Feed
- Permalink
- Report Inappropriate Content
Hi,
I tried to display the chart basing on what i understand ( im sorry im afraid of not really understanding the solution you proposed).
what i did is :
for the expressions : N-3 : Sum({$<ANNEE={$(=MAX(ANNEE)-3)}>}CA_NET_EN_DH)
N-2 : Sum({$<ANNEE={$(=MAX(ANNEE)-2)}>}CA_NET_EN_DH)
N-1 :Sum({$<ANNEE={$(=MAX(ANNEE)-1)}>}CA_NET_EN_DH)
Budget N :Sum({$<ANNEE={$(=MAX(ANNEE))}>}CA_NET_EN_DH)
Sales N : Sum({$<ANNEE={$(=MAX(ANNEE))}>}BUDGET_CA_NET_EN_DH)
Dimensions: Year
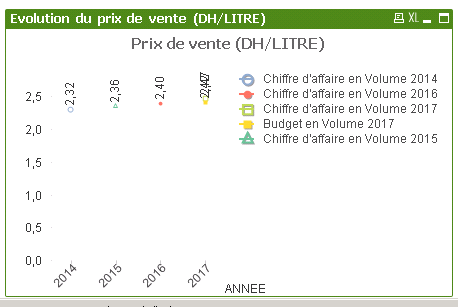
here is the result i get: its not really what i want

l need to have continous line between the points and for the year N i need to have separate points for sales and budget, juste like this:
- Mark as New
- Bookmark
- Subscribe
- Mute
- Subscribe to RSS Feed
- Permalink
- Report Inappropriate Content
You set four expressions and the chart is returning four dots. There is a little more different way to achieve this.
Please check the picture below and the attachement.
I think you can implement this solution to your project just with renamed fields.

Hope it will help!
- Mark as New
- Bookmark
- Subscribe
- Mute
- Subscribe to RSS Feed
- Permalink
- Report Inappropriate Content
Thank you so much for your help,
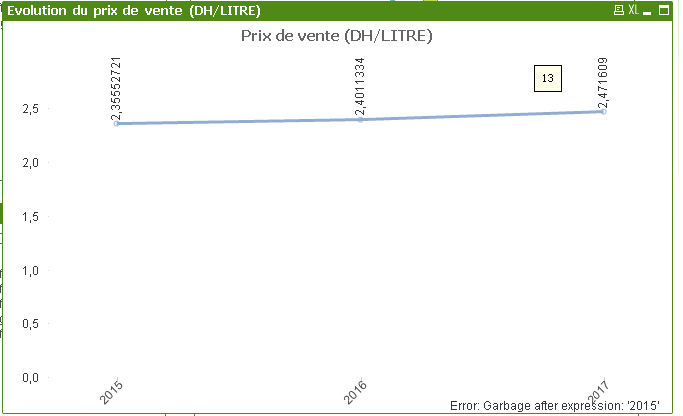
i implemented the solution you proposed and it seems working. Im juste facing a little probleme , the budget point is not displaying do. (Error garbage after expression :see screenshot)
the expression i ued is calculated = CA_NET_EN_DH / CA_NET_EN_LITRE
here is the dimension i use (vVL variable):
=chr(39)&
//condition to prevent error when min year is selected
if(len(Concat(DISTINCT{<ANNEE={">$(=max(ANNEE)-3) <=$(=max(ANNEE)-1)"}>}ANNEE))=0,max(ANNEE),
//combining year field values to the string separated by comma and single quotes
Concat(DISTINCT{<ANNEE={">$(=max(ANNEE)-3) <=$(=max(ANNEE)-1)"}>}ANNEE,chr(39)&','&chr(39))
)
&chr(39)&','&chr(39) //additional commas and quotes
&'budget-'&Right(max(ANNEE),2)&chr(39) //add a budget point
&','&chr(39)&max(ANNEE)&chr(39) //add the last point with max year
and the expression (vvl_exp):
=
//prevent error when min year is selected
if(len(Concat(DISTINCT{<ANNEE={">$(=max(ANNEE)-3) <=$(=max(ANNEE)-1)"}>}ANNEE))=0,'sum({<ANNEE={"$(=max(ANNEE))"}>}CA_NET_EN_DH)/sum({<ANNEE={"$(=max(ANNEE))"}>}CA_NET_EN_LITRE)',
//create a string with expressions
Concat(DISTINCT{<ANNEE={">$(=max(ANNEE)-3) <=$(=max(ANNEE)-1)"}>}'sum({<ANNEE={'&ANNEE&'}>}CA_NET_EN_DH)/sum({<ANNEE={'&ANNEE&'}>}CA_NET_EN_LITRE)',',')
)
&','
&'sum({<ANNEE={"$(=max(ANNEE))"}>}BUDGET_CA_NET_DH)/sum({<ANNEE={"$(=max(ANNEE))"}>}BUDGET_CA_NET_LITRE)' //expression for budget calculation
&','
&'sum({<ANNEE={"$(=max(ANNEE))"}>}CA_NET_EN_DH)/sum({<ANNEE={"$(=max(ANNEE))"}>}CA_NET_EN_LITRE)' //expression for max year
Please see the screenshot:

- « Previous Replies
- Next Replies »