Unlock a world of possibilities! Login now and discover the exclusive benefits awaiting you.
- Qlik Community
- :
- All Forums
- :
- QlikView App Dev
- :
- Re: Line chart showing monthly values over several...
- Subscribe to RSS Feed
- Mark Topic as New
- Mark Topic as Read
- Float this Topic for Current User
- Bookmark
- Subscribe
- Mute
- Printer Friendly Page
- Mark as New
- Bookmark
- Subscribe
- Mute
- Subscribe to RSS Feed
- Permalink
- Report Inappropriate Content
Line chart showing monthly values over several years
Hi there,
I have following problem and would appreciate any advice.
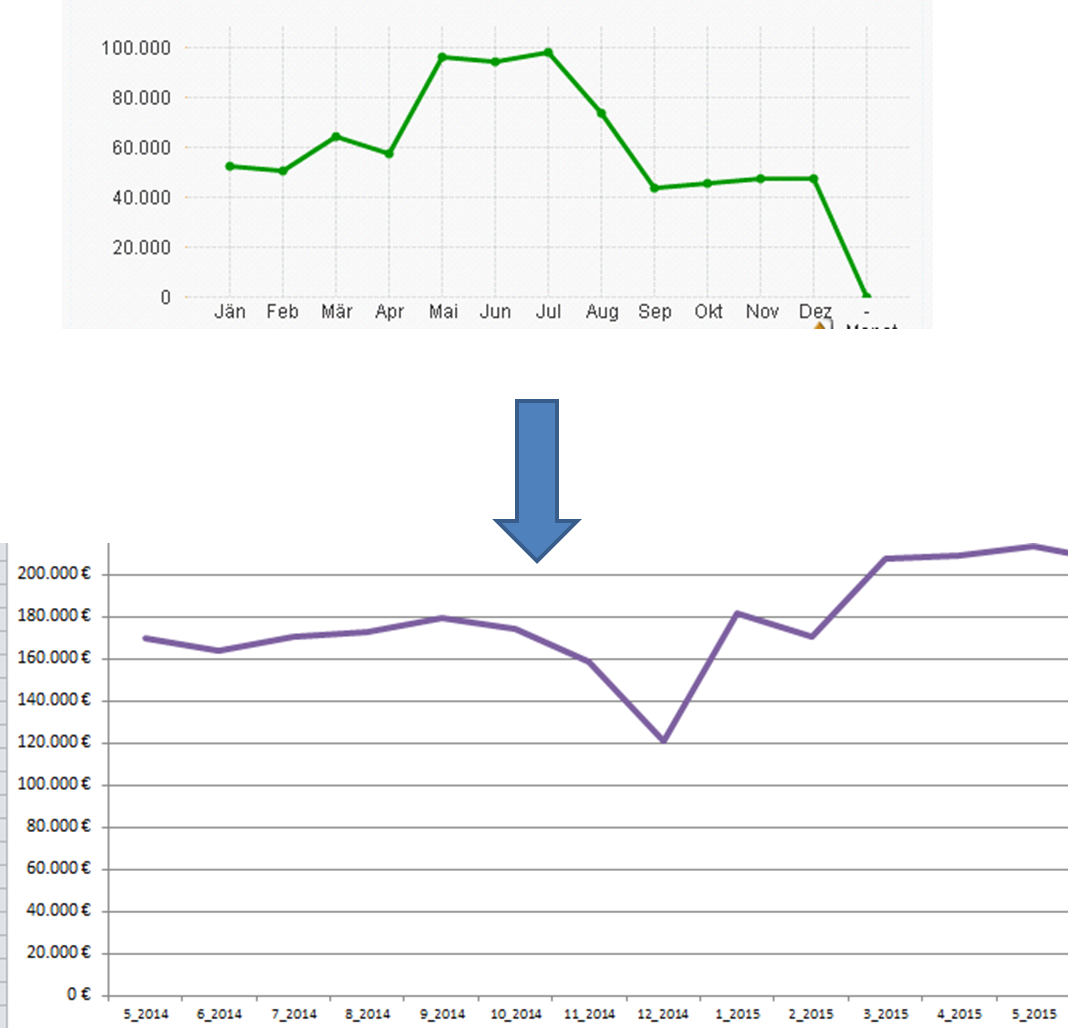
I have a line chart which shows the monthly sum of revenues (expression: sum of revenues, dimension: month).
My problem is, that it shows the average values for all months over several years (screen 1 in the attached image).
What I would like to have, is the monthly sum for all months for every year (screen 2 in the attached image).
Any ideas how I could solve this? Thanks for any help.
- « Previous Replies
-
- 1
- 2
- Next Replies »
- Mark as New
- Bookmark
- Subscribe
- Mute
- Subscribe to RSS Feed
- Permalink
- Report Inappropriate Content
I belive it would really help you in this case. Please see my reply above. Thanks.
- Mark as New
- Bookmark
- Subscribe
- Mute
- Subscribe to RSS Feed
- Permalink
- Report Inappropriate Content
I forgot to mention that your expression would need to be changed as well. This should work:
Sum(order_line_price)
- Mark as New
- Bookmark
- Subscribe
- Mute
- Subscribe to RSS Feed
- Permalink
- Report Inappropriate Content
Hi,
Use Date(datefield,'MMM-YYYY') in your load script.
Thanks
Kiran Kumar
- « Previous Replies
-
- 1
- 2
- Next Replies »