Unlock a world of possibilities! Login now and discover the exclusive benefits awaiting you.
- Qlik Community
- :
- All Forums
- :
- QlikView App Dev
- :
- Line graph showing days in month
- Subscribe to RSS Feed
- Mark Topic as New
- Mark Topic as Read
- Float this Topic for Current User
- Bookmark
- Subscribe
- Mute
- Printer Friendly Page
- Mark as New
- Bookmark
- Subscribe
- Mute
- Subscribe to RSS Feed
- Permalink
- Report Inappropriate Content
Line graph showing days in month
Hey everyone,
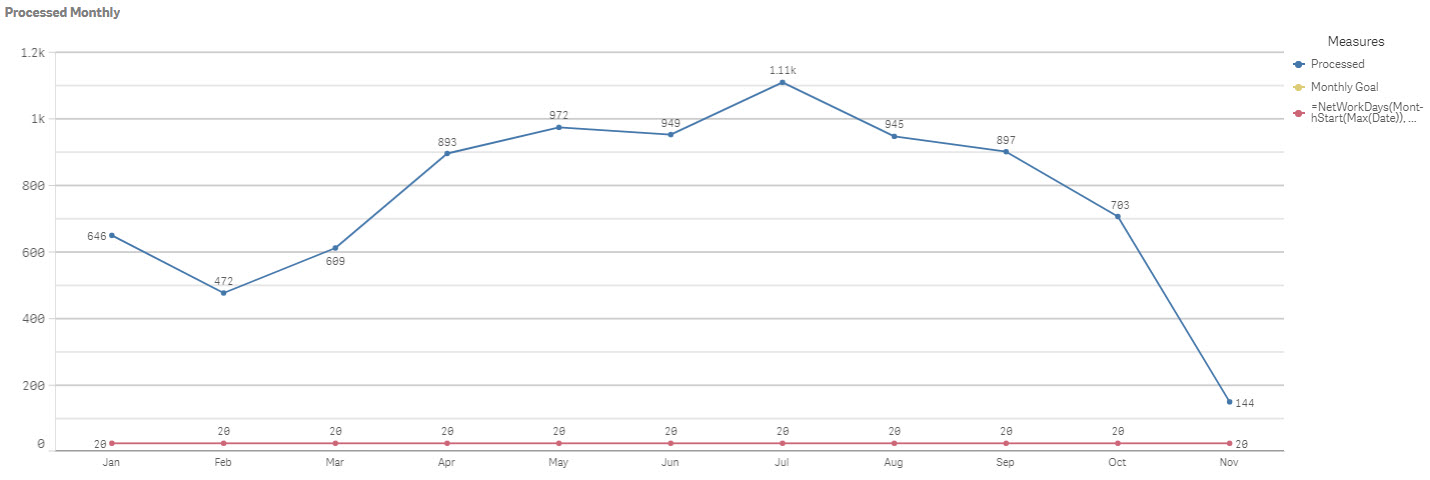
I am trying to make a graph that shows how many workdays are in a month per month.
This is the formula I am using to find workdays in month.
=NetWorkDays(MonthStart(Max(Date)), MonthEnd(Max(Date)), $(vHolidays))
when I put it into the graph it only shows the value for the current month into all months. I tried without Max and then the line just disappears.

Accepted Solutions
- Mark as New
- Bookmark
- Subscribe
- Mute
- Subscribe to RSS Feed
- Permalink
- Report Inappropriate Content
After looking at this a little closer, I was able to figure out I was using the wrong "Date" in the expression. The correct formula for this was...
=NetWorkDays(MonthStart(Max(Date_Dash)), MonthEnd(Max(Date_Dash)), $(vHolidays))