Unlock a world of possibilities! Login now and discover the exclusive benefits awaiting you.
- Qlik Community
- :
- All Forums
- :
- QlikView App Dev
- :
- Linear gauge in straight table
- Subscribe to RSS Feed
- Mark Topic as New
- Mark Topic as Read
- Float this Topic for Current User
- Bookmark
- Subscribe
- Mute
- Printer Friendly Page
- Mark as New
- Bookmark
- Subscribe
- Mute
- Subscribe to RSS Feed
- Permalink
- Report Inappropriate Content
Linear gauge in straight table
Hi guys,
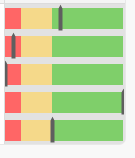
I've got the linear gauge chart in a straight table, but I need some changes in it. I have attached the snapshot of it below,

I want this chart vice versa i.e green region (Max region) should come first, then yellow and then red. Is it possible? if it is how can I do it? Plz anyone help me....
- Mark as New
- Bookmark
- Subscribe
- Mute
- Subscribe to RSS Feed
- Permalink
- Report Inappropriate Content
just double click on the expression label
or
Go to sort and Sort by Expression
add the expression you used for the gauge
If a post helps to resolve your issue, please accept it as a Solution.
- Mark as New
- Bookmark
- Subscribe
- Mute
- Subscribe to RSS Feed
- Permalink
- Report Inappropriate Content
Vineeth,
Thanks for your reply. But in sort tab, expression is disabled... I couldn't enable that one.
- Mark as New
- Bookmark
- Subscribe
- Mute
- Subscribe to RSS Feed
- Permalink
- Report Inappropriate Content
you have to select the Check box against it to enable it!
If a post helps to resolve your issue, please accept it as a Solution.
- Mark as New
- Bookmark
- Subscribe
- Mute
- Subscribe to RSS Feed
- Permalink
- Report Inappropriate Content
But it is disabled and I couldn't check the box... For other dimensions I can enable the expression but for this linear gauge I couldn't
- Mark as New
- Bookmark
- Subscribe
- Mute
- Subscribe to RSS Feed
- Permalink
- Report Inappropriate Content
Go to Expression tab
Select Expression
Representation (Linear Gauge) -- Gauge Settings
Untick Autowidth Segments
Now you can do Segments Setup at top RIght and set colors according to your need
- Mark as New
- Bookmark
- Subscribe
- Mute
- Subscribe to RSS Feed
- Permalink
- Report Inappropriate Content
yes, that is exactly where you enable it , for your Dimension
If a post helps to resolve your issue, please accept it as a Solution.