Unlock a world of possibilities! Login now and discover the exclusive benefits awaiting you.
- Qlik Community
- :
- All Forums
- :
- QlikView App Dev
- :
- Re: MTA
- Subscribe to RSS Feed
- Mark Topic as New
- Mark Topic as Read
- Float this Topic for Current User
- Bookmark
- Subscribe
- Mute
- Printer Friendly Page
- Mark as New
- Bookmark
- Subscribe
- Mute
- Subscribe to RSS Feed
- Permalink
- Report Inappropriate Content
MTA
HI,
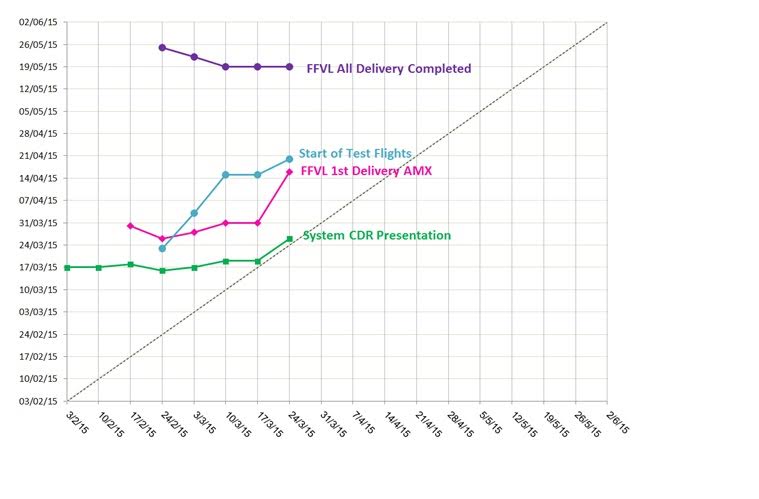
i want to make an mta graph like this:
what object should i use?
someone have an example for somthing similar?
adi
- Mark as New
- Bookmark
- Subscribe
- Mute
- Subscribe to RSS Feed
- Permalink
- Report Inappropriate Content
The image isn't showing up, you might have to repost the image.
Best,
Sunny
- Mark as New
- Bookmark
- Subscribe
- Mute
- Subscribe to RSS Feed
- Permalink
- Report Inappropriate Content

- Mark as New
- Bookmark
- Subscribe
- Mute
- Subscribe to RSS Feed
- Permalink
- Report Inappropriate Content
You can use a Line chart to imitate your chart.For grids and the dashed diagonal line you will have to use an image as background for the line chart.
- Mark as New
- Bookmark
- Subscribe
- Mute
- Subscribe to RSS Feed
- Permalink
- Report Inappropriate Content
Could also be a scatter plot.
Can you provide sample data/app?
Regards
Marco
- Mark as New
- Bookmark
- Subscribe
- Mute
- Subscribe to RSS Feed
- Permalink
- Report Inappropriate Content
Hi,
tabTemp:
LOAD 'Category '& RecNo() as Category,
    Date(MakeDate(2015)+Ceil(Rand()*60)) as Date
AutoGenerate 5;

table1:
LOAD Category,
    IterNo() as ID,
    Date(Date+(IterNo()-1)*7) as Date1,
    Date(Date+45+(Rand()-0.5)*10) as Date2
Resident tabTemp
While IterNo()<=Rand()*4+4;

LOAD 'bisector' as Category,
    1 as ID,
    *;
LOAD MonthStart(Min(RangeMin(Date1,Date2))) as Date1,
    MonthStart(Min(RangeMin(Date1,Date2))) as Date2
Resident table1;

LOAD 'bisector' as Category,
    2 as ID,
    *;
LOAD MonthEnd(Max(RangeMax(Date1,Date2))) as Date1,
    MonthEnd(Max(RangeMax(Date1,Date2))) as Date2
Resident table1;

DROP Table tabTemp;
hope this helps
regards
Marco
- Mark as New
- Bookmark
- Subscribe
- Mute
- Subscribe to RSS Feed
- Permalink
- Report Inappropriate Content
hi,
i did it with a line chart.
but now i want that the color of each line will be according to another dimnsion.
for exe-
each line represent a task
anf i want that the color of the line will be according to the project that the task in.
how can i do that??
- Mark as New
- Bookmark
- Subscribe
- Mute
- Subscribe to RSS Feed
- Permalink
- Report Inappropriate Content
Line chart properties--> expression --> refer snapshot
- Mark as New
- Bookmark
- Subscribe
- Mute
- Subscribe to RSS Feed
- Permalink
- Report Inappropriate Content
Marco,
legends at the end of the graph line instead of in a separate legend box is demonstrated by Stephen Redmong in his QlikView For Developers Cookbook (p38) and also here in his blog: Qlik Tips: Lose the Legend in Line Charts
Peter
- Mark as New
- Bookmark
- Subscribe
- Mute
- Subscribe to RSS Feed
- Permalink
- Report Inappropriate Content
Hi Peter,
nice solution, thank you.
Here my approach:
tabTemp:
LOAD 'Category '& RecNo() as Category,
    Date(MakeDate(2015)+Ceil(Rand()*60)) as Date
AutoGenerate 5;

table1:
LOAD Category,
    AutoNumberHash128(IterNo(),RecNo()) as ID,
    Date(Date+(IterNo()-1)*7) as Date1,
    Date(Date+45+(Rand()-0.5)*10) as Date2
Resident tabTemp
While IterNo()<=Rand()*4+4;

LOAD 'bisector' as Category,
    AutoNumberHash128(1,'bisector') as ID,
    *;
LOAD MonthStart(Min(RangeMin(Date1,Date2))) as Date1,
    MonthStart(Min(RangeMin(Date1,Date2))) as Date2
Resident table1;

LOAD 'bisector' as Category,
    AutoNumberHash128(2,'bisector') as ID,
    *;
LOAD MonthEnd(Max(RangeMax(Date1,Date2))) as Date1,
    MonthEnd(Max(RangeMax(Date1,Date2))) as Date2
Resident table1;

DROP Table tabTemp;

Left Join (table1)
LOAD Category,
    Max(ID) as ID,
    1 as IsLastID
Resident table1
Group By Category;
hope this helps
regards
Marco