Unlock a world of possibilities! Login now and discover the exclusive benefits awaiting you.
- Qlik Community
- :
- All Forums
- :
- QlikView App Dev
- :
- MTD,YTD & its total in a single chart
- Subscribe to RSS Feed
- Mark Topic as New
- Mark Topic as Read
- Float this Topic for Current User
- Bookmark
- Subscribe
- Mute
- Printer Friendly Page
- Mark as New
- Bookmark
- Subscribe
- Mute
- Subscribe to RSS Feed
- Permalink
- Report Inappropriate Content
MTD,YTD & its total in a single chart
Dear All,
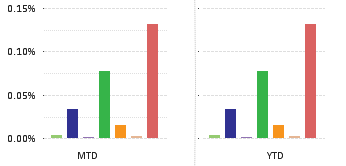
I have a requirement where I need to show MTD & YTD Performance Departmentwise & its TOTAL in a single bar chart.
Please find the enclosed data sheet for reference and provide a solution.
Thanks in Advance,
Regards,
Kumar
- Mark as New
- Bookmark
- Subscribe
- Mute
- Subscribe to RSS Feed
- Permalink
- Report Inappropriate Content
Hi Kumar,
Please check the attached one.
Regards,
Sajeevan
- Mark as New
- Bookmark
- Subscribe
- Mute
- Subscribe to RSS Feed
- Permalink
- Report Inappropriate Content
Thanks for your quick response Sajeevan.
Is there any other way of doing this?
Ths issue is that Department names are not fixed & we cant hardcode that.
I am aware that this can be done easily in QV11 but I have to use QV 10 SR3.
Regards,
Kumar
- Mark as New
- Bookmark
- Subscribe
- Mute
- Subscribe to RSS Feed
- Permalink
- Report Inappropriate Content
Hi Kumar,
Please check the attached one - third graph - Total line may not be possible
Regards,
Sajeevan
- Mark as New
- Bookmark
- Subscribe
- Mute
- Subscribe to RSS Feed
- Permalink
- Report Inappropriate Content
Sajeevan, I need to show the total as well. Thanks for your responses.
Just a request if anyone can provide some solution on this.
Regards,
Kumar
- Mark as New
- Bookmark
- Subscribe
- Mute
- Subscribe to RSS Feed
- Permalink
- Report Inappropriate Content
Hi,
I've attached one application with the chart showing total values also. Please verify it.
Thanks & Regards,
Arun Prasadh.N.
- Mark as New
- Bookmark
- Subscribe
- Mute
- Subscribe to RSS Feed
- Permalink
- Report Inappropriate Content
Dear Arun,
Thanks for response.
My requirement is slightly different, I need to have two dimensions and expression for MTD,YTD & also sum of (MTD,YTD)
Red Bar is the total of respective MTD & YTD.
Hope u get my requirement.
Thanks,
Kumar
- Mark as New
- Bookmark
- Subscribe
- Mute
- Subscribe to RSS Feed
- Permalink
- Report Inappropriate Content
Hi kumar,
PFA.