Unlock a world of possibilities! Login now and discover the exclusive benefits awaiting you.
- Qlik Community
- :
- All Forums
- :
- QlikView App Dev
- :
- Make Gauge use part of data and make gauge selecta...
- Subscribe to RSS Feed
- Mark Topic as New
- Mark Topic as Read
- Float this Topic for Current User
- Bookmark
- Subscribe
- Mute
- Printer Friendly Page
- Mark as New
- Bookmark
- Subscribe
- Mute
- Subscribe to RSS Feed
- Permalink
- Report Inappropriate Content
Make Gauge use part of data and make gauge selectable
I think I placed my question in the wrong section and I couldn't get it to move here. Excuse me for double post, but here is my question again:
Hey Guys,
I'm a beginner at Qlikview and I couldn't figure this out.
I have 2 tables like this:
Danger table:
dangerId sourceId dangerLevel
A015 source01 0.4
A016 source01 0.3
A017 source02 0.4
A018 source02 0.2
A019 source03 0.8
A020 source03 0.5
Source table
sourceId sourceName
source01 exampleName1
source02 exampleName2
source03 exampleName3
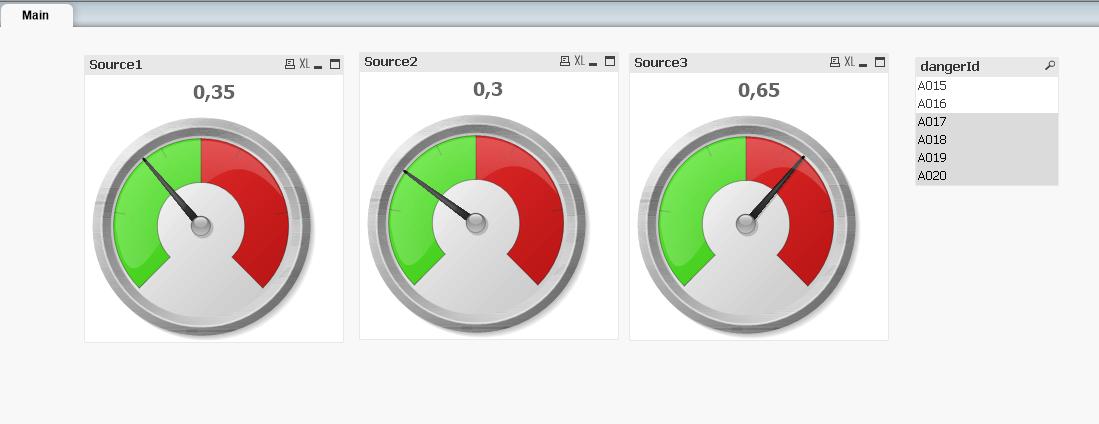
What is want is three gauges, showing the average danger level per source. And when I click a gauge, a table shows which dangers correspond to that source.
I am importing a database from SQL, I could alter the database if that would be better to solve this problem.
Thanks in advance,
Sijmen
Accepted Solutions
- Mark as New
- Bookmark
- Subscribe
- Mute
- Subscribe to RSS Feed
- Permalink
- Report Inappropriate Content
I've uploaded a .qvw with the solution to your answer: http://community.qlik.com/docs/DOC-7287
To show the average dangerlevel in the gauge you can use the following expression with set analysis, respectively for source01, source02 and source03: =avg({<sourceId={'source01'}>}dangerLevel)
best regards, wouter
- Mark as New
- Bookmark
- Subscribe
- Mute
- Subscribe to RSS Feed
- Permalink
- Report Inappropriate Content
Gauges are not clickable. However you can put a transparent text box on top of it and assign an action to that text box. For example a Select in Field action to select the sourceid corresponding with the underlying gauge.
talk is cheap, supply exceeds demand
- Mark as New
- Bookmark
- Subscribe
- Mute
- Subscribe to RSS Feed
- Permalink
- Report Inappropriate Content
Ok, thank you, I will try that.
Then for the other question, how do I make a gauge show only the average value of dangerLevel of a certain source?
- Mark as New
- Bookmark
- Subscribe
- Mute
- Subscribe to RSS Feed
- Permalink
- Report Inappropriate Content
I've uploaded a .qvw with the solution to your answer: http://community.qlik.com/docs/DOC-7287
To show the average dangerlevel in the gauge you can use the following expression with set analysis, respectively for source01, source02 and source03: =avg({<sourceId={'source01'}>}dangerLevel)
best regards, wouter
- Mark as New
- Bookmark
- Subscribe
- Mute
- Subscribe to RSS Feed
- Permalink
- Report Inappropriate Content
I understand the example, but I still didn't get it to work in my actual app.
I use a SQL database which I import into qlikview.
Does the following statement in your load script really matter:
(ooxml, embedded labels, table is Danger);
As I could not use that with my SQL statement.
- Mark as New
- Bookmark
- Subscribe
- Mute
- Subscribe to RSS Feed
- Permalink
- Report Inappropriate Content
(ooxml, embedded labels, table is Danger) is a filter that tells the load statement what kind of source file it's dealing with. ooxml means an .xlsx excel file. Embedded labels means to use the column names in the excel table as field names. Danger is the sheet name from the excel file that should be loaded.
For getting data from an SQL database you first open a connection to the database using the CONNECT statement. You then use a SELECT statement to get the data from the database. Optionally you can use a preceding LOAD statement to further process the data you retrieve from the database.
talk is cheap, supply exceeds demand
- Mark as New
- Bookmark
- Subscribe
- Mute
- Subscribe to RSS Feed
- Permalink
- Report Inappropriate Content
I imported the database earlier, that was not a problem.
But when I change this: =avg({<sourceId={'source01'}>}dangerLevel)
to this: =avg({<TerminalId={'769DC483-C9C5-41A1-83A1-9EDQ00FEF087'}>}DangerLevel)
It does not show anything, giving 'No data to display' in the gauge object.
This is my import statement:
Dangers:
SQL SELECT DangerId,
DangerLevel,
TerminalId
FROM database.Dangers;
The import is succesful.
EDIT:
Somehow the Id's get between brackets when imported.
The following statement worked:
=avg({<TerminalId={'{769DC483-C9C5-41A1-83A1-9EDQ00FEF087}'}>}DangerLevel)
- Mark as New
- Bookmark
- Subscribe
- Mute
- Subscribe to RSS Feed
- Permalink
- Report Inappropriate Content
Without looking at the actual data I cannot say why you get that message.
talk is cheap, supply exceeds demand