Unlock a world of possibilities! Login now and discover the exclusive benefits awaiting you.
- Qlik Community
- :
- All Forums
- :
- QlikView App Dev
- :
- Map Colors to specific companies
- Subscribe to RSS Feed
- Mark Topic as New
- Mark Topic as Read
- Float this Topic for Current User
- Bookmark
- Subscribe
- Mute
- Printer Friendly Page
- Mark as New
- Bookmark
- Subscribe
- Mute
- Subscribe to RSS Feed
- Permalink
- Report Inappropriate Content
Map Colors to specific companies
Hello,
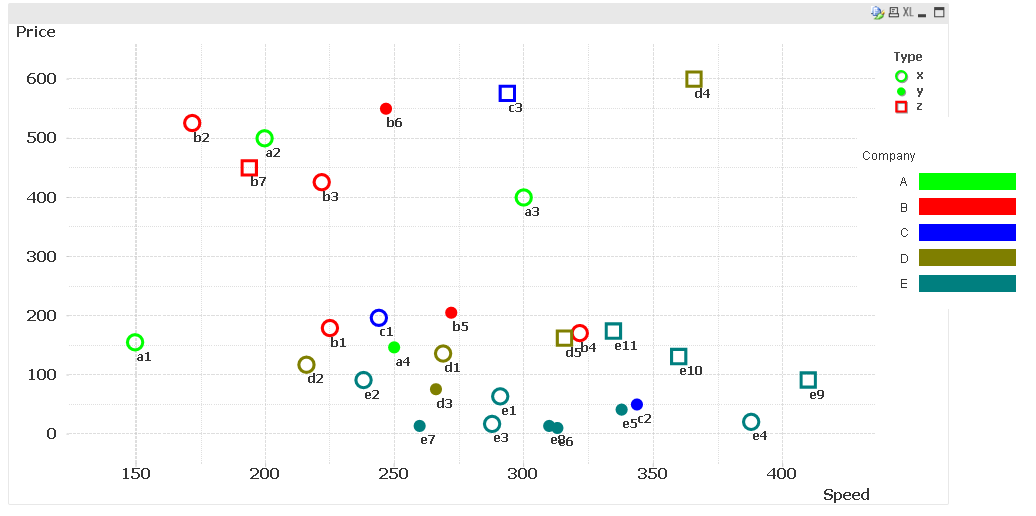
I have a scatter chart with a bunch of data points. Each data point is a product. These products or data points belong to specifi companies, so I have 10 data points that belong to company A, 22 data points that belong to company B and so on.
I want the name of the data points (so the products) of company A to be colored in red, the name of the data points (so the products) of company B to be colored in green and so on.
Do you know how to do that ?
thanks, dani
- Tags:
- new_to_qlikview
- « Previous Replies
-
- 1
- 2
- Next Replies »
- Mark as New
- Bookmark
- Subscribe
- Mute
- Subscribe to RSS Feed
- Permalink
- Report Inappropriate Content
Go to first expression of your Scatter Chart...
Click on + sign and write under background color something like below...
IF(Company = 'A', RED(), IF(Company = 'B', Green(), BLUE()))
- Mark as New
- Bookmark
- Subscribe
- Mute
- Subscribe to RSS Feed
- Permalink
- Report Inappropriate Content
Hi Manish,
It does not work. Doing what you say it changes the colors of the marks in each data point. However what I want is not to change the colors of the marks but the names next to the mark (so the products) based on the company they belong to.
Thanks, dani
- Mark as New
- Bookmark
- Subscribe
- Mute
- Subscribe to RSS Feed
- Permalink
- Report Inappropriate Content
Can you load your sample file?
- Mark as New
- Bookmark
- Subscribe
- Mute
- Subscribe to RSS Feed
- Permalink
- Report Inappropriate Content
Hi Manish,
Attached you have the sample. I want to the name of the products from Company A in green (so this is to have the text "a1, a2, a3, a4" colored in green), Company B in red (so this is to have the text "b1, b2, b3, b4, b5, b6, b7" colored in red) and so on.
thanks, dani
- Mark as New
- Bookmark
- Subscribe
- Mute
- Subscribe to RSS Feed
- Permalink
- Report Inappropriate Content
You may use Color() and FieldIndex() both together.
Color(1) will return the first color of the graph. see Color tab in the chart properties.
FieldIndex('FieldName', value) will return an index of the value, it means the number of the value in the field (the 1st, the 2nd ...)
Nestedtogether, you may affect one company to a specific color.
Fabrice
- Mark as New
- Bookmark
- Subscribe
- Mute
- Subscribe to RSS Feed
- Permalink
- Report Inappropriate Content
You can assign colors in the script already, which is a more robust and faster solution. See http://community.qlik.com/blogs/qlikviewdesignblog/2012/12/04/colors-in-charts
HIC
- Mark as New
- Bookmark
- Subscribe
- Mute
- Subscribe to RSS Feed
- Permalink
- Report Inappropriate Content
And this is what you get if you define the colors in the script:

- Mark as New
- Bookmark
- Subscribe
- Mute
- Subscribe to RSS Feed
- Permalink
- Report Inappropriate Content
Hi Henric,
I think the question is how to change color of a1, a2,a3, b1, b2, b3...
I am also finding the same from QlikView Chart Properties but unable to find.
- Mark as New
- Bookmark
- Subscribe
- Mute
- Subscribe to RSS Feed
- Permalink
- Report Inappropriate Content
That's the point. What I want to change is the 'font' of the label, not the mark associated to the label.
Taking a1 product as an example: I want the "a" and the "1" to be in green instead of black.
- « Previous Replies
-
- 1
- 2
- Next Replies »