Unlock a world of possibilities! Login now and discover the exclusive benefits awaiting you.
- Qlik Community
- :
- All Forums
- :
- QlikView App Dev
- :
- Re: Market share - straight table
- Subscribe to RSS Feed
- Mark Topic as New
- Mark Topic as Read
- Float this Topic for Current User
- Bookmark
- Subscribe
- Mute
- Printer Friendly Page
- Mark as New
- Bookmark
- Subscribe
- Mute
- Subscribe to RSS Feed
- Permalink
- Report Inappropriate Content
Market share - straight table
Hello I am trying to create straight table like this:
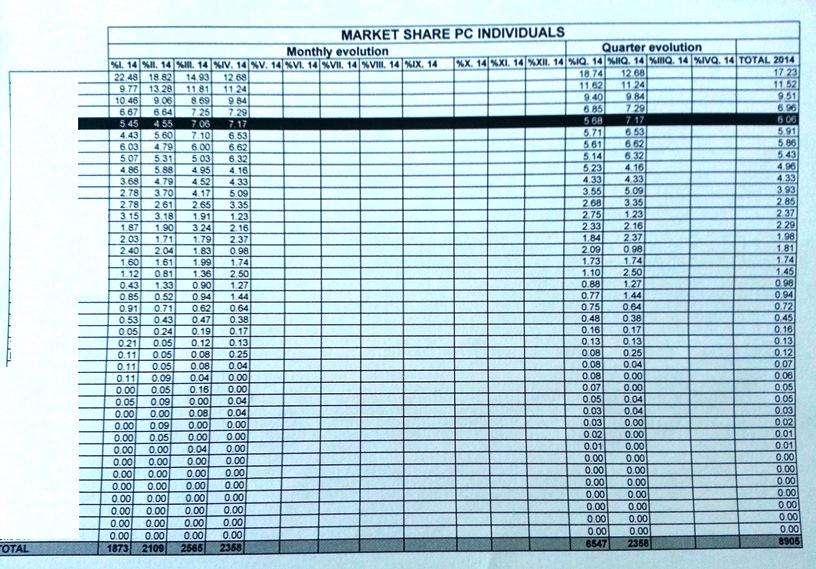
In the left column (erased) there have been a list of car makers (BMW, Audi, etc...).
Expressions should show market share for current month/ quarter/ whole year...
I just dont know how to compare one´s car maker sales with all car makers within one month / year / quarter...
Please do not paste qvw files - i dont have registered version of QV...
Thank you for every suggestion 
- Mark as New
- Bookmark
- Subscribe
- Mute
- Subscribe to RSS Feed
- Permalink
- Report Inappropriate Content
What you'll have to do is create another dimension with the values 'Month','Quarter' and 'Year'. That's easiest done in a new table:
ReportPeriods:
LOAD * INLINE [
PeriodInterval, ReportPeriod, Month
Month, %I. 14, %I. 14
Month, %II. 14, %II. 14
Month, %III. 14, %III. 14
Month, %IV. 14, %IV. 14
...etc
Month, %XII. 14, %XII. 14
Quarter %IQ. 14, %I. 14
Quarter, %IQ. 14, %II. 14
Quarter, %IQ. 14, %III. 14
Quarter, %IIQ. 14, %IV. 14
Quarter, %IIQ. 14, %V 14
...etc
Quarter, %IVQ. 14, %XII 14
Year, Total 2014, %I. 14
Year, Total 2014, %I. 14
Year, Total 2014, %I. 14
...etc
Year, Total 2014, %XII. 14
];
You then use PeriodInterval and ReportPeriod as dimensions in your pivot table
talk is cheap, supply exceeds demand
- Mark as New
- Bookmark
- Subscribe
- Mute
- Subscribe to RSS Feed
- Permalink
- Report Inappropriate Content
OK, so using LOAD * Inline... I am able to create new dimensions...
I tried this: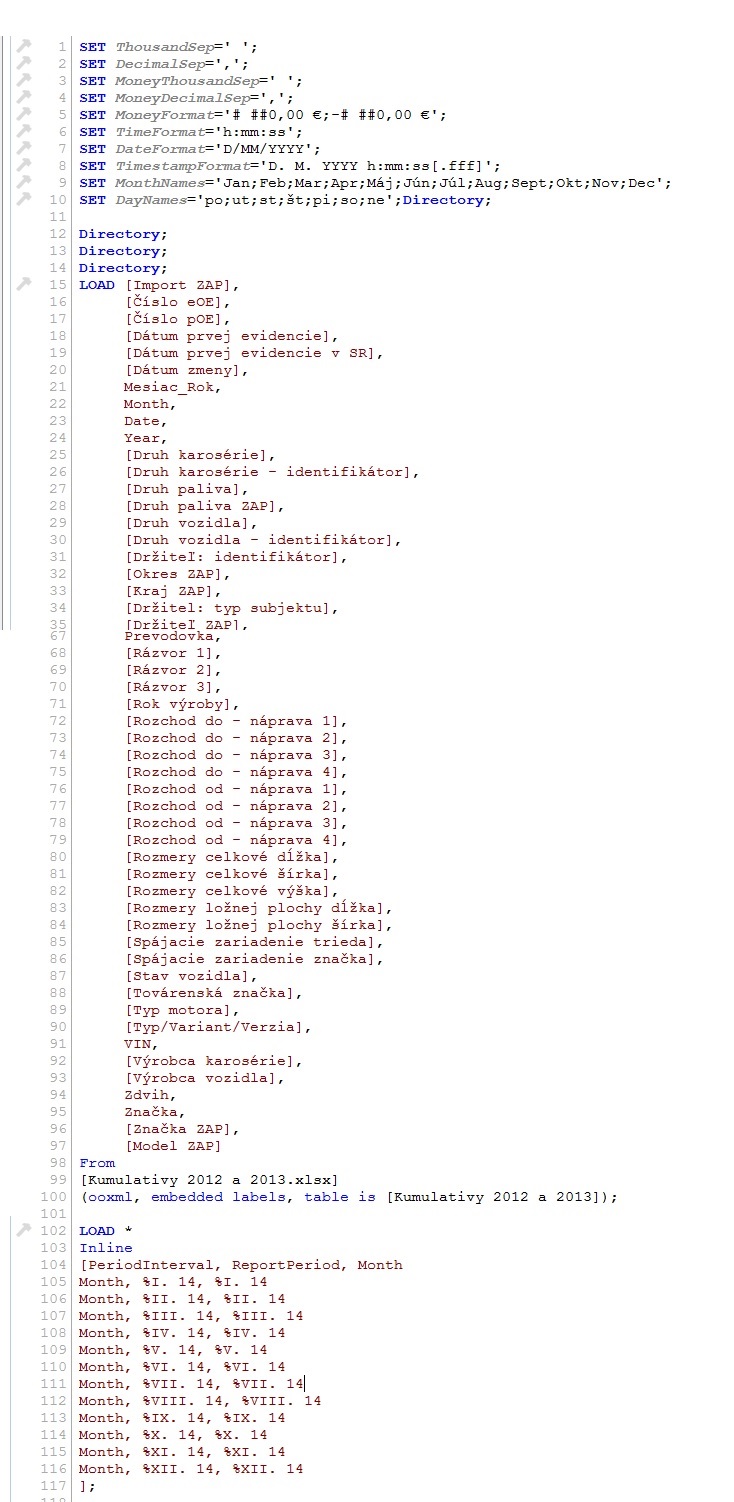
...but after Reload... my app has only three dimensions - Month, PeriodInterval and ReportPeriod... anyway - this looks like a way how to get my own values into created dimension... That is step one, while trying to make table like on first image... (still dont know how to preserve original dimensions)
But what I need to do is to write right expression to calculate the share...
Or Am I totally wrong? ...I am a real beginner with no IT grounding... so It would be great if you could explain simpler (e.g. I was not sure if LOAD * INLINE... is going to script, or to some sheet object /because you mentioned some new table/ )
)
- Mark as New
- Bookmark
- Subscribe
- Mute
- Subscribe to RSS Feed
- Permalink
- Report Inappropriate Content
It's impossible to tell what's going on without having the data your using. Can you post the excel file or an excel file with fake data but the same fields and field names?
edit:
Ok, I used the column headings of your first screenshot as values for the inline table ReportPeriods. You don't seem to have these values in your source data. Your Month field contains only the month name, which makes it unusable for the ReportPeriods table. The field Mesiac_Rok looks like a better candidate.
SalesData:
LOAD * FROM ...excel_source_file...;
ReportPeriods:
LOAD 'Month' as PeriodInterval,
date(Mesiac_Rok,'%M. YY') as ReportPeriod,
Mesiac_Rok
Resident SalesData;
concatenate(ReportPeriods)
LOAD 'Quarter' as PeriodInterval,
'%' & ceil(Month(Mesiac_Rok)/3) & 'Q. ' & date(Mesiac_Rok,'YY') as ReportPeriod,
Mesiac_Rok
Resident SalesData;
concatenate(ReportPeriods)
LOAD 'Year' as PeriodInterval,
'TOTAL ' & Year(Mesiac_Rok) as ReportPeriod,
Mesiac_Rok
Resident SalesData;
talk is cheap, supply exceeds demand
- Mark as New
- Bookmark
- Subscribe
- Mute
- Subscribe to RSS Feed
- Permalink
- Report Inappropriate Content
Yes... of course.... It is excel file containing cars registred in Slovakia... every row represents one car - manufacturer, model, year, engine, VIN number... etc, etc... When working with these data, I almost everytime use Count(VIN) to calculate number I need...
CALENDAR COLUMNS ARE:
Dátum prvej evidencie Date of first evidence | Dátum prvej evidencie v SR Date of first evidence in SR | Dátum zmeny Date of change | Mesiac_Rok Month_Year | Month Month | Date Date | Year Year |
Here is sample of the sourcefile: http://www.zapsr.sk/wp-content/uploads/2014/08/Nov%C3%A1-polo%C5%BEka-Pracovn%C3%BD-h%C3%A1rok-progr...
*Actually I realized that I am working only with data for 2012 and 2013
- Mark as New
- Bookmark
- Subscribe
- Mute
- Subscribe to RSS Feed
- Permalink
- Report Inappropriate Content
Thank you very much! ...this allows me to create suitable columns, it is definitley step forward
my table now looks like this
My problems are:
1.) It shows years 2013 and 2014 instead of 2012 and 2013 (there is no 2014 date in source Excel file)
2.) It shows two years (13+14), I want only to compare sales share within one year
3.) My table show Count(VIN) numbers, but I want to express it as market share. e.g.: If Audi sold 50 cars in january 2013 and whole market in january 2013 was 5000 - share would be 1%... now I have just "50" as a result in table cell