Unlock a world of possibilities! Login now and discover the exclusive benefits awaiting you.
- Qlik Community
- :
- All Forums
- :
- QlikView App Dev
- :
- Re: Month Over Month , Quarter Over Quarter % Chan...
- Subscribe to RSS Feed
- Mark Topic as New
- Mark Topic as Read
- Float this Topic for Current User
- Bookmark
- Subscribe
- Mute
- Printer Friendly Page
- Mark as New
- Bookmark
- Subscribe
- Mute
- Subscribe to RSS Feed
- Permalink
- Report Inappropriate Content
Month Over Month , Quarter Over Quarter % Change in Cost
All,
I have materials and their cost which change month over month.
what I want is
1. I want to show trend of a material eg copper, the % change from previous month
2. The same for Quarter over Over
For a Quarter , the last month cost in that Quarter has to be considered for showing % change in costs.
Attaching a sample with two materials cost, created a graph with copper which shows trend in the cost but I want the same for Cost Change difference %.
For eg
For Feb : (Feb cost - Jan Cost)/ Jan Cost * 100
Hope I am clear in my requirement
Thanks
Kumar
- « Previous Replies
-
- 1
- 2
- Next Replies »
Accepted Solutions
- Mark as New
- Bookmark
- Subscribe
- Mute
- Subscribe to RSS Feed
- Permalink
- Report Inappropriate Content
If your data is sorted by date (which your attached sample seems to be, then try this expression in QV11.2 SR9:
(Sum({<material = {'Copper'}>}COST)/Aggr(Above(Sum({<material = {'Copper'}, Month>}COST)), Year, Month)) - 1
- Mark as New
- Bookmark
- Subscribe
- Mute
- Subscribe to RSS Feed
- Permalink
- Report Inappropriate Content
1st question that I have for you is, do you have QV12? If you do, you would save yourself from a lot of hassle of doing some sorting in the script. Look here why -> The sortable Aggr function is finally here!
I am still not sure what you need for Q/Q, but for M/M you can use this expression (in QV12)
(Sum({<material = {'Copper'}>}COST)/Aggr(Above(Sum({<material = {'Copper'}, Month>}COST)), (Year, (NUMERIC)), Month)) - 1
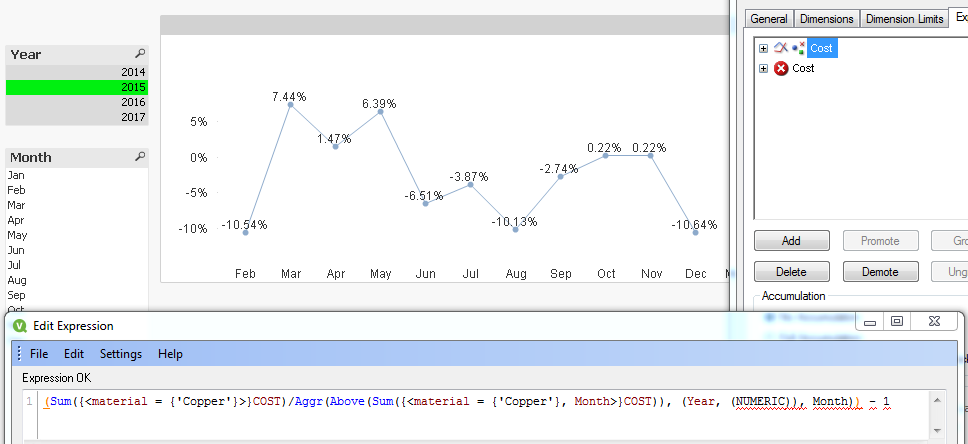
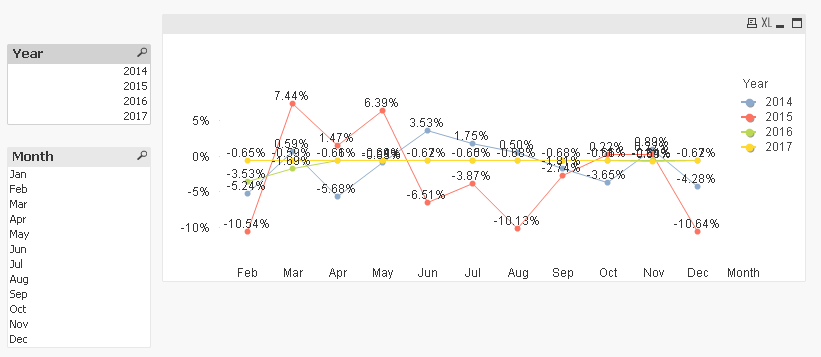
You will see that the expression editor is showing error, but the result is what you would desire. I made a selection in the year because otherwise we were seeing a lot of lines which were difficult to interpret, but it will definitely work with all years
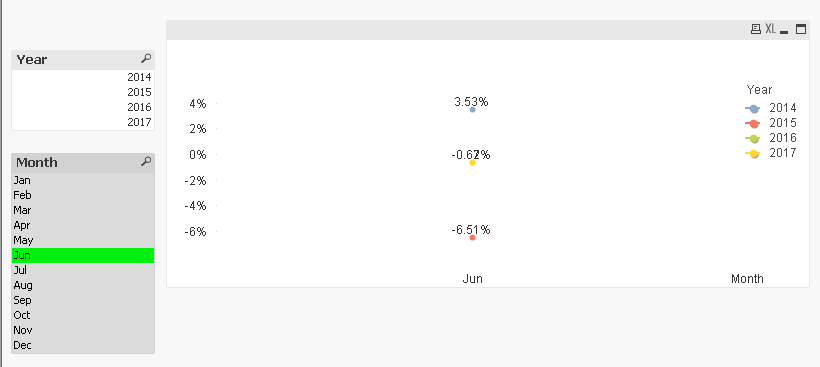
Additionally will also work if you make a selection for a particular Month (let's say we select Jun)
- Mark as New
- Bookmark
- Subscribe
- Mute
- Subscribe to RSS Feed
- Permalink
- Report Inappropriate Content
Hi Sunny,
I am using 11.20 SR9 .
1. Can we do anything from the script side for this
2. Coming to Quarter over Quarter, just like what have you done , if we select a year the graph should show % change between Quarters, here the logic is we will have three costs for a quarter so we have to take the last month COST for comparison.
Can you rewrite the expression which suits SR9 and explain a bit what have you done.
Thanks
Kiran Kumar
- Mark as New
- Bookmark
- Subscribe
- Mute
- Subscribe to RSS Feed
- Permalink
- Report Inappropriate Content
If your data is sorted by date (which your attached sample seems to be, then try this expression in QV11.2 SR9:
(Sum({<material = {'Copper'}>}COST)/Aggr(Above(Sum({<material = {'Copper'}, Month>}COST)), Year, Month)) - 1
- Mark as New
- Bookmark
- Subscribe
- Mute
- Subscribe to RSS Feed
- Permalink
- Report Inappropriate Content
Hi Sunny,
everything looks fine but is there a way that "Jan" month can also be shown by saying 0% , I tried with "Suppress zero values"
Thanks
Kiran Kumar
- Mark as New
- Bookmark
- Subscribe
- Mute
- Subscribe to RSS Feed
- Permalink
- Report Inappropriate Content
Hi
Try like this
Exp:
Alt((Sum({<material = {'Copper'}>}COST)/Aggr(Above(Sum({<material = {'Copper'}, Month>}COST)), Year, Month)) - 1,0)
Presentation:
Uncheck suppress zero values and check zero on bars.
Hope it helps
Please close the thread by marking correct answer & give likes if you like the post.
- Mark as New
- Bookmark
- Subscribe
- Mute
- Subscribe to RSS Feed
- Permalink
- Report Inappropriate Content
Thanks Mayil for your suggestion , I acheived the 'Jan' one by writing a if condition
if(IsNull(Aggr(Above(Sum({<material = {'Copper'}, Month>}COST)), Year, Month) - 1),0,
(Sum({<material = {'Copper'}>}COST)/Aggr(Above(Sum({<material = {'Copper'}, Month>}COST)), Year, Month)) - 1)
Thanks
Kiran Kumar
- Mark as New
- Bookmark
- Subscribe
- Mute
- Subscribe to RSS Feed
- Permalink
- Report Inappropriate Content
Do you want to see a 0 or would you want to see a % comparison for last year's December month for the month of January?
- Mark as New
- Bookmark
- Subscribe
- Mute
- Subscribe to RSS Feed
- Permalink
- Report Inappropriate Content
Sunny,
Zero is fine, because 'Jan' is baseline for others. Any how thanks alot for the expression and follow up
Regards
Kiran Kumar
- Mark as New
- Bookmark
- Subscribe
- Mute
- Subscribe to RSS Feed
- Permalink
- Report Inappropriate Content
Awesome 
Are you still looking for a Quarter on Quarter expression, or is that not a requirement?
Best,
Sunny
- « Previous Replies
-
- 1
- 2
- Next Replies »