Unlock a world of possibilities! Login now and discover the exclusive benefits awaiting you.
- Qlik Community
- :
- All Forums
- :
- QlikView App Dev
- :
- Re: MonthYear MonthYear - 1 in Bar Chart
- Subscribe to RSS Feed
- Mark Topic as New
- Mark Topic as Read
- Float this Topic for Current User
- Bookmark
- Subscribe
- Mute
- Printer Friendly Page
- Mark as New
- Bookmark
- Subscribe
- Mute
- Subscribe to RSS Feed
- Permalink
- Report Inappropriate Content
MonthYear MonthYear - 1 in Bar Chart
All,
I am trying to create a bar chart that has 1 dimension MonthYear with no selections. I want to show quantity of current month and last year same month.
Any advice on the formulas to do so?
Thank you!
- Mark as New
- Bookmark
- Subscribe
- Mute
- Subscribe to RSS Feed
- Permalink
- Report Inappropriate Content
If you're using MonthYear as a dimension and want to show each MonthYear along with its corresponding month from the year before you neeed an AsOf table that links each MonthYear value with it corresponding year-before month. See this document: Calculating rolling n-period totals, averages or other aggregations
talk is cheap, supply exceeds demand
- Mark as New
- Bookmark
- Subscribe
- Mute
- Subscribe to RSS Feed
- Permalink
- Report Inappropriate Content
Hi
Try this in your expression
=SUM({<[Date Field]={">=$(=MonthStart((Max([Date Field])))<=$(=MonthEnd((Max([Date Field])))"},Year=,Month=,Quarter=>
+
<[Date Field]={">=$(=MonthStart((Max([Order Date])),-12))<=$(=MonthEnd((Max([Date Field]),-12))"},Year=,Month=,Quarter=>}Fieldname)
-12 here specifies the same moth in previous year
- Mark as New
- Bookmark
- Subscribe
- Mute
- Subscribe to RSS Feed
- Permalink
- Report Inappropriate Content
This is not working... I am only using MonthYear as my dimension.
- Mark as New
- Bookmark
- Subscribe
- Mute
- Subscribe to RSS Feed
- Permalink
- Report Inappropriate Content
Hi,
This is working for month year dimension too if possible pls post your sample file
- Mark as New
- Bookmark
- Subscribe
- Mute
- Subscribe to RSS Feed
- Permalink
- Report Inappropriate Content
here is a screen shot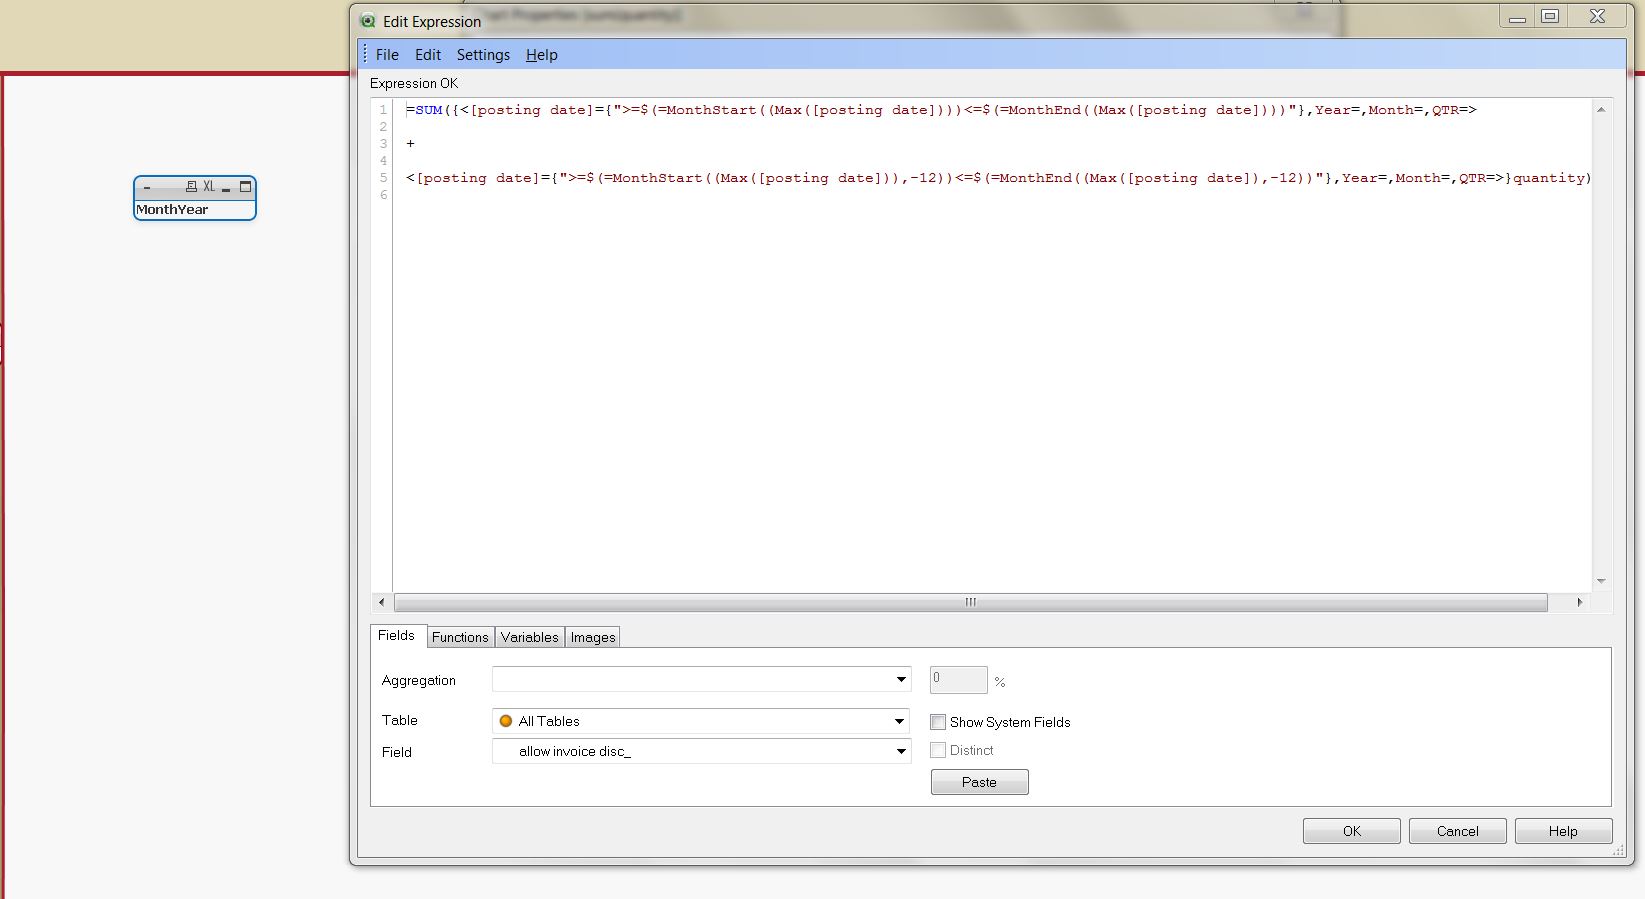
- Mark as New
- Bookmark
- Subscribe
- Mute
- Subscribe to RSS Feed
- Permalink
- Report Inappropriate Content
Can you post a sample app with small data?
- Mark as New
- Bookmark
- Subscribe
- Mute
- Subscribe to RSS Feed
- Permalink
- Report Inappropriate Content
Here is a sample file.