Unlock a world of possibilities! Login now and discover the exclusive benefits awaiting you.
- Qlik Community
- :
- All Forums
- :
- QlikView App Dev
- :
- Mouseover info in graph with two expressions
- Subscribe to RSS Feed
- Mark Topic as New
- Mark Topic as Read
- Float this Topic for Current User
- Bookmark
- Subscribe
- Mute
- Printer Friendly Page
- Mark as New
- Bookmark
- Subscribe
- Mute
- Subscribe to RSS Feed
- Permalink
- Report Inappropriate Content
Mouseover info in graph with two expressions
Hi all.
Referring to this thread: https://community.qlik.com/message/662370#662370
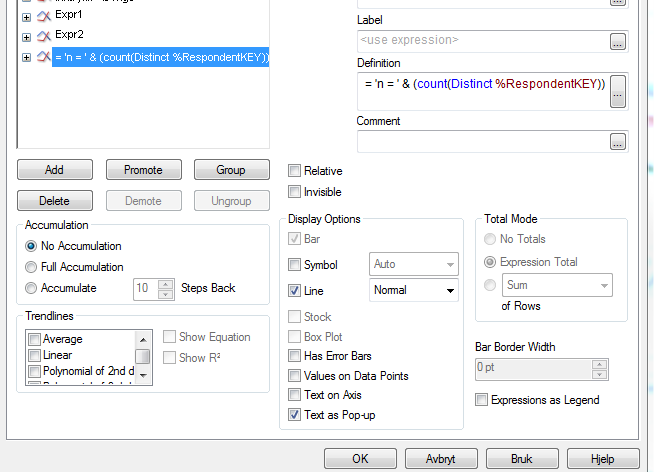
I want to be able to see 'n' (number of respondents) when looking at a chart with percentages.
My problem is that when I do what is suggested in the thread above I get the same 'n' for both lines(see picture below). The lines are two different expressions in the graph. How do I get the 'mouse over info pop up' to display the 'n' for the different lines in the graph. I am 100% sure that the 'n' is not the same for the two lines.
= 'n = ' & (count(Distinct %RespondentKEY))


Thank you ![]()
- Mark as New
- Bookmark
- Subscribe
- Mute
- Subscribe to RSS Feed
- Permalink
- Report Inappropriate Content
No matter if n is the same or not for the two expressions,
your pop up expression
= 'n = ' & (count(Distinct %RespondentKEY))
is only calculated once per dimension value, it will return a single value for the Count().
So if you want to see to different numbers, I would assume that you need two aggregations.
What are the dimensions and expressions used in your chart? Could you post a small sample QVW?
- Mark as New
- Bookmark
- Subscribe
- Mute
- Subscribe to RSS Feed
- Permalink
- Report Inappropriate Content
Hi. I have included a qvw that shows what I want to achieve.
The test3 graph should show me the number in addition to the %number.
Does anyone know how I achieve that? ![]()
Thank you