Unlock a world of possibilities! Login now and discover the exclusive benefits awaiting you.
- Qlik Community
- :
- All Forums
- :
- QlikView App Dev
- :
- Re: Multi-line Dimension cannot be viewed Horizont...
- Subscribe to RSS Feed
- Mark Topic as New
- Mark Topic as Read
- Float this Topic for Current User
- Bookmark
- Subscribe
- Mute
- Printer Friendly Page
- Mark as New
- Bookmark
- Subscribe
- Mute
- Subscribe to RSS Feed
- Permalink
- Report Inappropriate Content
Multi-line Dimension cannot be viewed Horizontally on Axis
Good day,
What I am trying to do is to have the financial year in one line and the quarter below it in a horizontal alignment.
I have tried the following piece of code:
'FY' & [Financial Year] & chr(10) & 'Q' & [Financial Quarter]
The code above works well when I view the dimension diagonally or vertically but for some strange reason I can't view it horizontally.
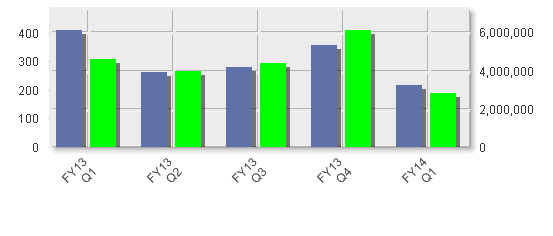
The moment I change it to a horizontal view this is what happens:
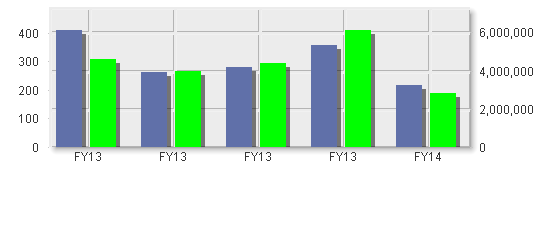
Please could anyone help me understand why this is the case and how can I align this horizontally and show all lines.
I have Qlikview 10 installed on my laptop.
Thanks.
Kind Regards,
Celeste
- Mark as New
- Bookmark
- Subscribe
- Mute
- Subscribe to RSS Feed
- Permalink
- Report Inappropriate Content
Hi,
Click on chart and Press CTRL+SHIFT , now you will see the borders within chart, now with mouse drag the bottom border little up and you will see the data.
Regards,
Kaushik Solanki
- Mark as New
- Bookmark
- Subscribe
- Mute
- Subscribe to RSS Feed
- Permalink
- Report Inappropriate Content
Hi Kaushik,
Thanks for your response.
I tried to shift the centre of the graph many different ways but I still can’t view the second line.
- Mark as New
- Bookmark
- Subscribe
- Mute
- Subscribe to RSS Feed
- Permalink
- Report Inappropriate Content
Hi ,
You can also use "Trellis" in the dimension tab of the properties.
Regards
Yusuf
- Mark as New
- Bookmark
- Subscribe
- Mute
- Subscribe to RSS Feed
- Permalink
- Report Inappropriate Content
Thank you for your help Yusuf.
But I have to create one graph and not many little ones. My manager would like only this view.
Kind Regards,
Celeste
- Mark as New
- Bookmark
- Subscribe
- Mute
- Subscribe to RSS Feed
- Permalink
- Report Inappropriate Content
I have the same issue, if anyone could help, would be just great