Unlock a world of possibilities! Login now and discover the exclusive benefits awaiting you.
- Qlik Community
- :
- All Forums
- :
- QlikView App Dev
- :
- Multiple Dimensions on Pie Chart. Don't understand...
- Subscribe to RSS Feed
- Mark Topic as New
- Mark Topic as Read
- Float this Topic for Current User
- Bookmark
- Subscribe
- Mute
- Printer Friendly Page
- Mark as New
- Bookmark
- Subscribe
- Mute
- Subscribe to RSS Feed
- Permalink
- Report Inappropriate Content
Multiple Dimensions on Pie Chart. Don't understand why it shows legend for only some
Hello,
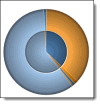
I discovered something cool (to a newbie like me) with pie chart. I put in multiple dimensions and it shows a pie chart within a pie chart like this:
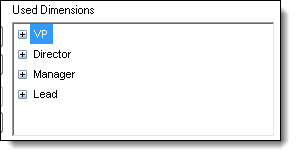
I really like this because it lets me convey a lot in a little space. So I started playing with it and adding more dimensions. Now I'm a bit confused about how this actually works. The dimensions I added are VP, Director, Manager and Lead. Those are names of people in those positions and the "hierarchy" is as I've listed it.
I also have a MultiBox to let user select values for each of those Fields like this:

In the Chart I have the dimensions listed like this:
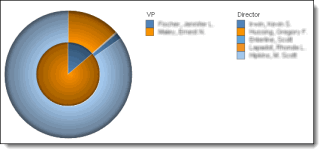
What surprised me was that the chart showed multiple legends. I liked that as well, but I'm confused about how it's doing that. When I don't have anything selected it shows this and it makes sense. Since I haven't selected anything, it's showing me the top two levels (VP and Director) and the names for each.
However, if I select a specific VP, the legends change to show the Managers and Leads. I expected (hoped) it would show the Directors and Managers since those are the next two levels under VP
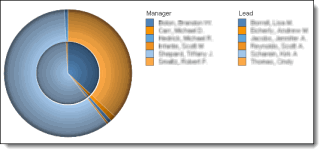
If I choose a specific Director, it still shows the Manager and Leads legends. This is what I would expect.
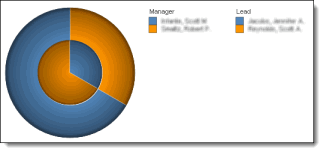
So the question is "why isn't it showing the Director and Manager legends when I select a VP?"
Thanks for any help
David
Accepted Solutions
- Mark as New
- Bookmark
- Subscribe
- Mute
- Subscribe to RSS Feed
- Permalink
- Report Inappropriate Content
The Ref Manual says that Pie Charts cannot display more than two dimensions. It may be random behavior of situations that the Pie Chart object isn't designed to handle.
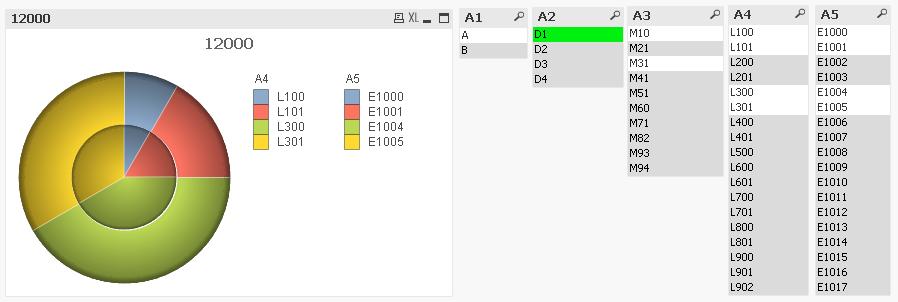
I made a simulation of your description in a QVW and I get the exact same behaviour as you describe for four dimensions. For three, it works OK. For five it does again weird things.
One trend I can see:
- No selections = pie chart shows first two dimensions
- At least one selection anywhere = pie chart shows last two dimensions
- Mark as New
- Bookmark
- Subscribe
- Mute
- Subscribe to RSS Feed
- Permalink
- Report Inappropriate Content
Can it have something to do with the fact that QlikView possibly prefers the first few dimensions that have multiple active values?
Put list boxes for the four dimensions next to the pie chart and observe their content when making your selections.
- Mark as New
- Bookmark
- Subscribe
- Mute
- Subscribe to RSS Feed
- Permalink
- Report Inappropriate Content
Peter,
Thanks for the quick reply. I don't follow, though. There are multiple active values for each level. For example, when I select either VP, there are multiple active values for Director.
Can you elaborate if I've misunderstood what you meant?
David
- Mark as New
- Bookmark
- Subscribe
- Mute
- Subscribe to RSS Feed
- Permalink
- Report Inappropriate Content
The Ref Manual says that Pie Charts cannot display more than two dimensions. It may be random behavior of situations that the Pie Chart object isn't designed to handle.
I made a simulation of your description in a QVW and I get the exact same behaviour as you describe for four dimensions. For three, it works OK. For five it does again weird things.
One trend I can see:
- No selections = pie chart shows first two dimensions
- At least one selection anywhere = pie chart shows last two dimensions
- Mark as New
- Bookmark
- Subscribe
- Mute
- Subscribe to RSS Feed
- Permalink
- Report Inappropriate Content
Picture:
- Mark as New
- Bookmark
- Subscribe
- Mute
- Subscribe to RSS Feed
- Permalink
- Report Inappropriate Content
From Help:
Pie charts normally show the relation between a single dimension and a single expression, but can sometimes have two dimensions.
From myself ![]() :
:
Pie chart is not a very useful chart, especially when you have more than one dimension... Think of using some other type, maybe bar chart or a pivot table since you have many dimensions.
- Mark as New
- Bookmark
- Subscribe
- Mute
- Subscribe to RSS Feed
- Permalink
- Report Inappropriate Content
Thanks for the responses.
I know and agree that in a lot of cases Pie Charts aren't the best choice, but for this particular one I just like the way it looks. Who knows, once clients see it, they may decide they do NOT like it.
The way I got around it was to remove the top dimension (VP) and then it shows me the legends as I want them.
Thanks again!