Unlock a world of possibilities! Login now and discover the exclusive benefits awaiting you.
- Qlik Community
- :
- All Forums
- :
- QlikView App Dev
- :
- Multiple dimensions and multiple expressions has g...
- Subscribe to RSS Feed
- Mark Topic as New
- Mark Topic as Read
- Float this Topic for Current User
- Bookmark
- Subscribe
- Mute
- Printer Friendly Page
- Mark as New
- Bookmark
- Subscribe
- Mute
- Subscribe to RSS Feed
- Permalink
- Report Inappropriate Content
Multiple dimensions and multiple expressions has grouped chart with working of filters.
Hi all,
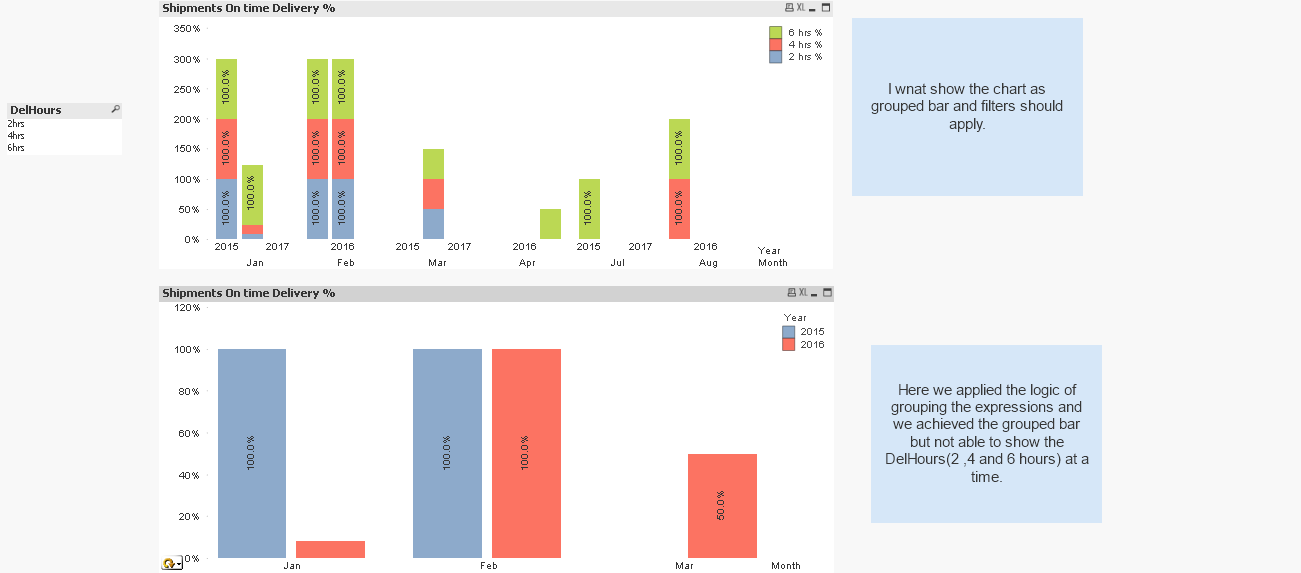
we want show the grouped chart with multiple dimensions and multiple expressions and filters should apply.
Here am attaching the example. Please go through it. swuehlhicstalwar1sreerangasane
- Mark as New
- Bookmark
- Subscribe
- Mute
- Subscribe to RSS Feed
- Permalink
- Report Inappropriate Content
I would create a dimension which is a valuelist based on a concat of your DelHours field, then us the same valuelist in a pick(match( expression, that should give you what you want.
Dimension will be something like =valuelist(concat(chr(39)&DelHours&chr(39),','))
Expression will be something like: pick(match(valuelist(concat(chr(39)&DelHours&chr(39),',')),'6hrs','4hrs','2hrs'),Sum({<DeliveryHours ={"<=6"}>} [Shipment Count] ) / Sum([Shipment Count]),Sum({<DeliveryHours ={"<=4"}>} [Shipment Count] ) / Sum([Shipment Count]),Sum({<DeliveryHours ={"<=2"}, DelHours=>} [Shipment Count] ) / Sum({1}[Shipment Count]))
Sorry haven't time to sort the exact syntax but that should be close ish