Unlock a world of possibilities! Login now and discover the exclusive benefits awaiting you.
- Qlik Community
- :
- All Forums
- :
- QlikView App Dev
- :
- Need help in generating a report
- Subscribe to RSS Feed
- Mark Topic as New
- Mark Topic as Read
- Float this Topic for Current User
- Bookmark
- Subscribe
- Mute
- Printer Friendly Page
- Mark as New
- Bookmark
- Subscribe
- Mute
- Subscribe to RSS Feed
- Permalink
- Report Inappropriate Content
Need help in generating a report
Hi
I need help in generating a report from a similar data
myData:
LOAD * INLINE [StoreID, Brand, SurveyID, Question, Points, PointsOF
1,XX,1,Q1,3,4
1,XX,1,Q2,2,3
1,XX,1,Q3,5,7
2,XX,2,Q1,4,4
2,XX,2,Q2,1,3
2,XX,2,Q3,6,7
3,XX,3,Q1,2,4
3,XX,3,Q2,1,3
3,XX,3,Q3,2,7
4,XX,4,Q1,1,4
4,XX,4,Q2,3,3
4,XX,4,Q3,7,7
2,XX,5,Q1,1,4
2,XX,5,Q2,2,3
2,XX,5,Q3,3,7
5,XX,6,Q1,3,4
5,XX,6,Q2,3,3
5,XX,6,Q3,7,7
6,XX,7,Q1,4,4
6,XX,7,Q2,2,3
6,XX,7,Q3,6,7
];
- The actual data might contain Multiple brands.
- Each Brand can have multiple stores (stores have unique StoreIDs)
- Each Store might have multiple surveys.
- Each survey might have multiple questions
- Relationship StoreID - Brand is fixed - in other words a store can have one brand.
The score of each shop is determined by (sum of points) /(sum of pointsof)
for example the score of
storeID=1 is (3+2+5)/(4+3+7) = 10/14 = 71.42%
StoreID=2 is (4+1+6+1+2+3)/(4+3+7+4+3+7) = 0.6071 = 60.71%
StoreID=3 is 5/14 = 35.71%
StoreID=4 is 11/14 = 78.57%
StoreID=5 is 14/14 = 100%
StoreID=6 is 12/14 = 85.71%
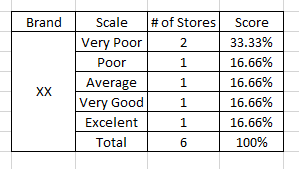
The scale is determined as follows:
Greater or equal to 88% - Excellent
82% - 87.99% - Very Good
75%-81.99% - Average
70% - 74.99% - Poor
Less than 70% - Very Poor
User selects a brand from a list.
I need to produce for specific brand the following:
Thank you all for your kind help
take care
- Mark as New
- Bookmark
- Subscribe
- Mute
- Subscribe to RSS Feed
- Permalink
- Report Inappropriate Content
Please find the attached file. Hope this will help you.