Unlock a world of possibilities! Login now and discover the exclusive benefits awaiting you.
- Qlik Community
- :
- All Forums
- :
- QlikView App Dev
- :
- Need to create a comparison chart based on Period
- Subscribe to RSS Feed
- Mark Topic as New
- Mark Topic as Read
- Float this Topic for Current User
- Bookmark
- Subscribe
- Mute
- Printer Friendly Page
- Mark as New
- Bookmark
- Subscribe
- Mute
- Subscribe to RSS Feed
- Permalink
- Report Inappropriate Content
Need to create a comparison chart based on Period
Hi,
I want to make a chart which shows the below details in Qlikview. For eg.
Data selected for Collection month April
| April | ||
| Month | Collection | |
| -3 | Jan-16 | 24000 |
| -2 | Feb-16 | 2406 |
| -1 | Mar-16 | 4562 |
| 0 | Apr-16 | 49000 |
| 1 | May-16 | 5000 |
| 2 | Jun-16 | 4000 |
| 3 | Jul-16 | 2000 |
| 4 | Aug-16 | 10 |
| 5 | Sep-16 | 5 |
Data selected for Collection month June
| June | ||
| Month | Collection | |
| Jan-16 | ||
| -4 | Feb-16 | 40 |
| -3 | Mar-16 | 2400 |
| -2 | Apr-16 | 24 |
| -1 | May-16 | 3000 |
| 0 | Jun-16 | 50000 |
| 1 | Jul-16 | 5100 |
| 2 | Aug-16 | 3000 |
| 3 | Sep-16 | 1000 |
| 4 | Oct-16 | 500 |
| 5 | Nov-16 | 50 |
| 6 | Dec-16 | 5 |
Now the chart should compare the period wise. if I select Apr for first period it should consider as period 0 and rest month should get calculated accordingly. And if second period is June, June should be consider as Period 0. and chart should compare the period 0 of 1st table to period 0 of second table. As shown below
| Y Axis | ||
| X Axis | April | June |
| -4 | 0 | 40 |
| -3 | 24000 | 2400 |
| -2 | 2406 | 24 |
| -1 | 4562 | 3000 |
| 0 | 49000 | 50000 |
| 1 | 5000 | 5100 |
| 2 | 4000 | 3000 |
| 3 | 2000 | 1000 |
| 4 | 10 | 500 |
| 5 | 5 | 50 |
| 6 | 0 | 5 |
Attached is the chart created in excel.
- « Previous Replies
- Next Replies »
- Mark as New
- Bookmark
- Subscribe
- Mute
- Subscribe to RSS Feed
- Permalink
- Report Inappropriate Content
Hi,
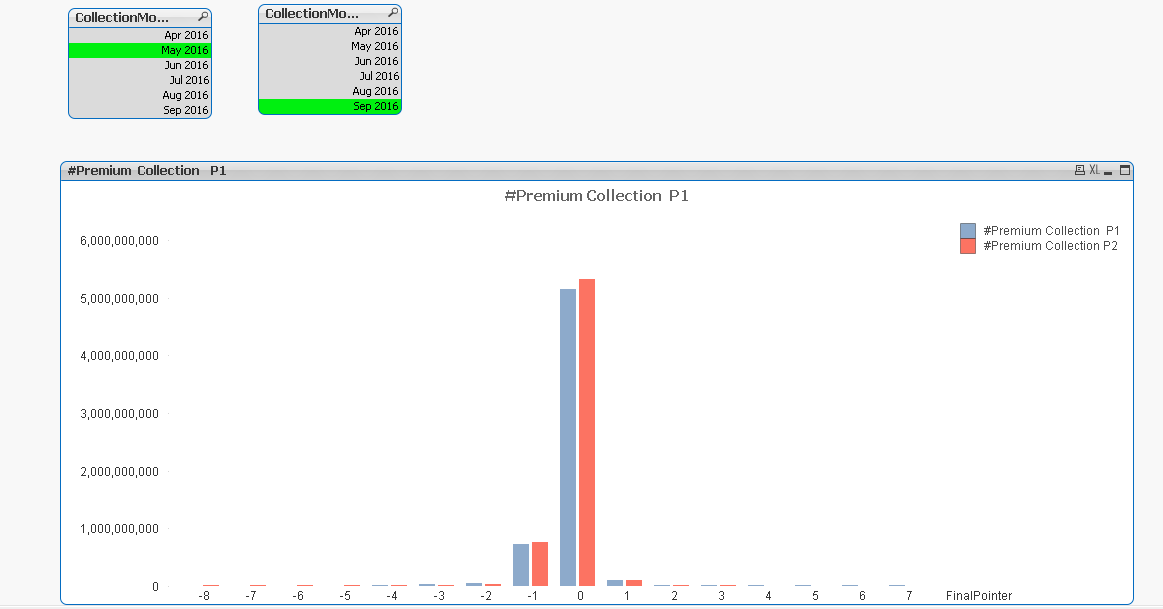
I have got the output as expected. Just wanted to do few formatting in the graph. As in chart I am comparing the Collection amount for 2 different period ,
1) I want to show the percentage of Collection.
2) In Legends instead of '#Premium Collection P1' , I want to display #Premium Collection May 2016, I mean I want to fetch the month selected in 1st List box. Same with second it should be '#Premium Collection Sep 2016'
- Mark as New
- Bookmark
- Subscribe
- Mute
- Subscribe to RSS Feed
- Permalink
- Report Inappropriate Content
There is alternate state, for a while it confused me, but I gotcha
Use below expressions for lable
='#Premium Collection '& Only({ChartAlt1}CollectionMonth)
='#Premium Collection '& Only({ChartAlt2}CollectionMonth)
- Mark as New
- Bookmark
- Subscribe
- Mute
- Subscribe to RSS Feed
- Permalink
- Report Inappropriate Content
Cool!!! got the expected label. But Percentage value m still stuck.  . Just wanted to inform I have restricted the period value with only 2016 year. So when I want to calculate the % of Month Apr2016 it should be Sum(Collection- Apr2016)/ Sum(Collection Jan2016......Dec 2016).
Note: I have months from 2007 to 2017 (Advance payment).... I don't want to include all those in % calculation.
- « Previous Replies
- Next Replies »