Unlock a world of possibilities! Login now and discover the exclusive benefits awaiting you.
- Qlik Community
- :
- All Forums
- :
- QlikView App Dev
- :
- One linear trendline on stacked bar chart
- Subscribe to RSS Feed
- Mark Topic as New
- Mark Topic as Read
- Float this Topic for Current User
- Bookmark
- Subscribe
- Mute
- Printer Friendly Page
- Mark as New
- Bookmark
- Subscribe
- Mute
- Subscribe to RSS Feed
- Permalink
- Report Inappropriate Content
One linear trendline on stacked bar chart
How do i insert ONE linear trendline on a stacked bar chart? The default functionality is for multiple trendlines to be shown, which reflect each value of the dimension. I just want one for the total
I'm guessing i need to use a reference line, but can't figure our how to make it work.
The expression for my bar chart is very simple
=SUM(Revenue/1000)
and the primary dimension is calendar week.
So do I need to do some sort of week count in the reference line expression?
Thanks
- Tags:
- new_to_qlikview
Accepted Solutions
- Mark as New
- Bookmark
- Subscribe
- Mute
- Subscribe to RSS Feed
- Permalink
- Report Inappropriate Content
I found the answer elsewhere. Thanks for your help though.
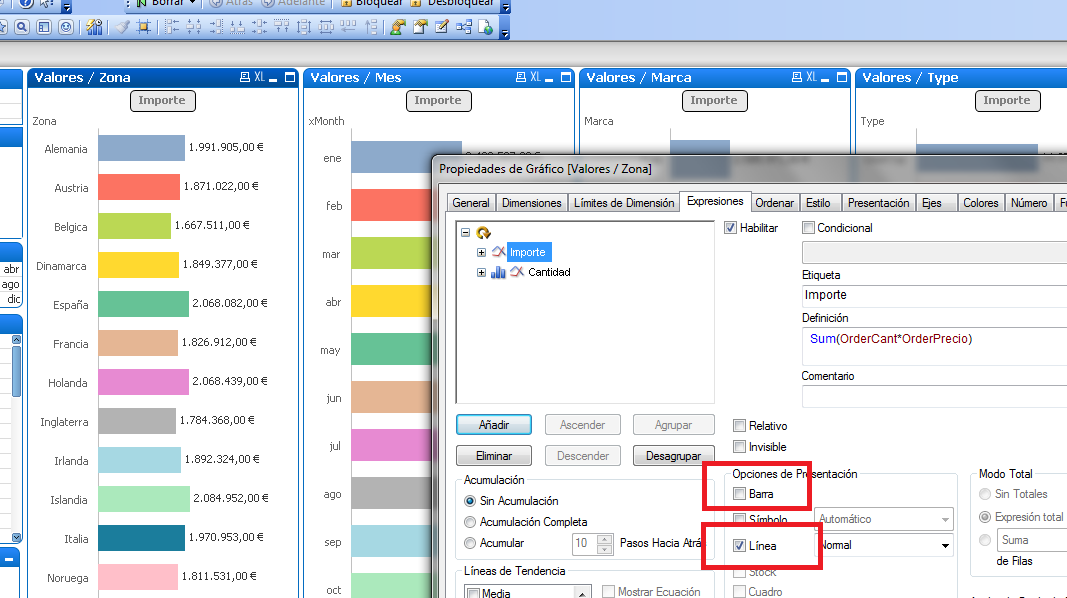
You can try to create an expression, unchecking 'Bar' and checking 'Values on data', in this expression is where you have to check the linear trendline.
The expression should be something like:
Sum(TOTAL <Week> Revenue/1000)
- Mark as New
- Bookmark
- Subscribe
- Mute
- Subscribe to RSS Feed
- Permalink
- Report Inappropriate Content
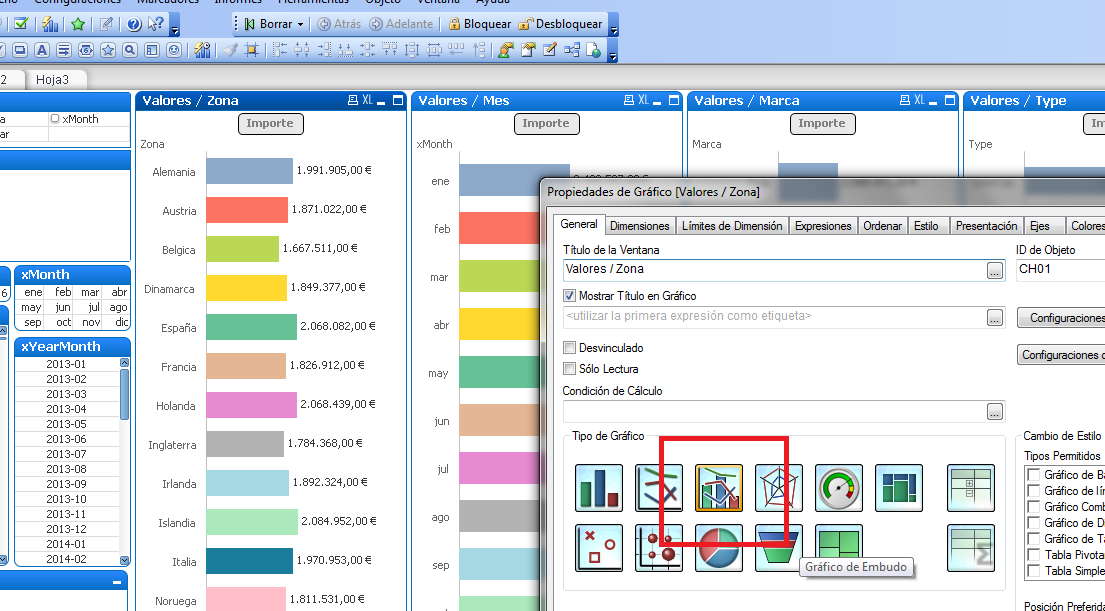
You can use graphic mixed bars & lines, and select for each expresion if your representation is bar or line
- Mark as New
- Bookmark
- Subscribe
- Mute
- Subscribe to RSS Feed
- Permalink
- Report Inappropriate Content
This does not work, because the secondary dimension I have affects the chart. As you cannot have a line on a combo chart and retain the stacked appearance of the bars. It always reverts to Grouped
- Mark as New
- Bookmark
- Subscribe
- Mute
- Subscribe to RSS Feed
- Permalink
- Report Inappropriate Content
Sorry. I meant tertiary dimension
This is how my chart currently looks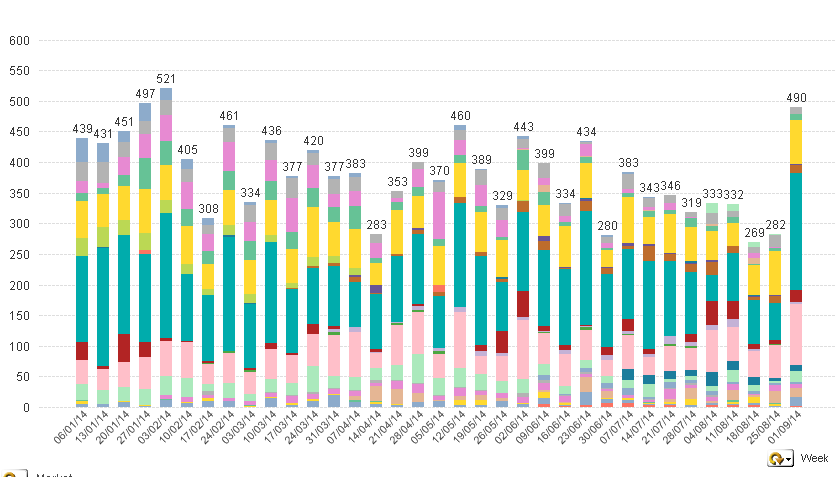
- Mark as New
- Bookmark
- Subscribe
- Mute
- Subscribe to RSS Feed
- Permalink
- Report Inappropriate Content
And, you want a line for the total?
Can you upload the file qv?
I think the same possibility las entry post
- Mark as New
- Bookmark
- Subscribe
- Mute
- Subscribe to RSS Feed
- Permalink
- Report Inappropriate Content
The information is sensitive so I can't really upload it unfortunately.
The line i need is as if I removed my tertiary demension. In the example below, i have removed my tertiary dimension and simply ticked 'Linear' on the trendlines. This is exactly what I need, except that I need to retain the tertiary demension and the stacked appearance of the bar chart.
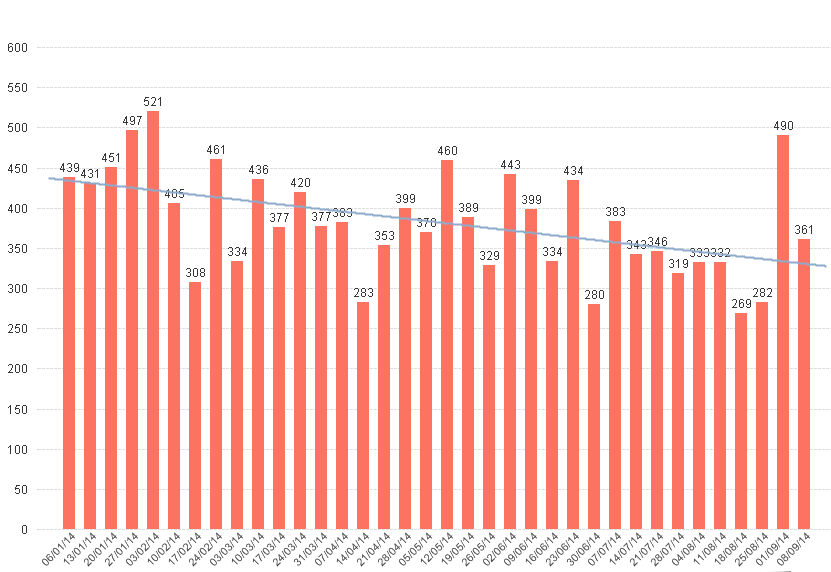
This is what happens when I retain the dimension
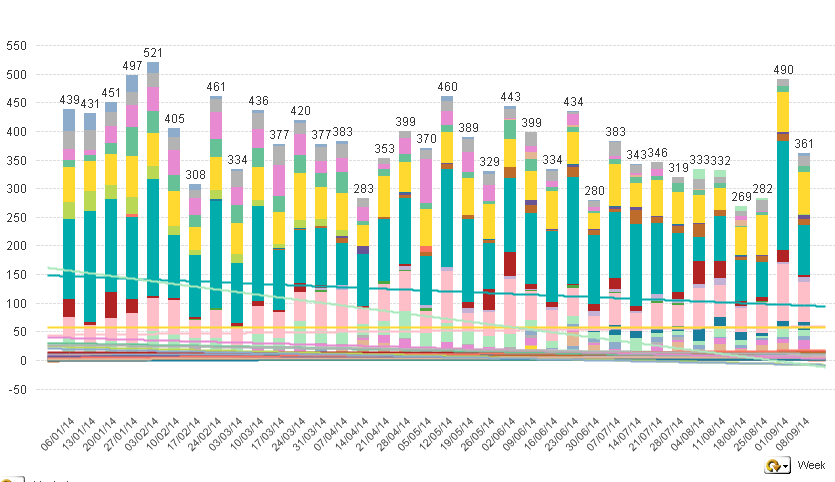
As you can see, a trendline for each value appears! I only want one, for the total trend.
- Mark as New
- Bookmark
- Subscribe
- Mute
- Subscribe to RSS Feed
- Permalink
- Report Inappropriate Content
I found the answer elsewhere. Thanks for your help though.
You can try to create an expression, unchecking 'Bar' and checking 'Values on data', in this expression is where you have to check the linear trendline.
The expression should be something like:
Sum(TOTAL <Week> Revenue/1000)