Unlock a world of possibilities! Login now and discover the exclusive benefits awaiting you.
- Qlik Community
- :
- All Forums
- :
- QlikView App Dev
- :
- Re: Overlay selection and totals in bar graph
- Subscribe to RSS Feed
- Mark Topic as New
- Mark Topic as Read
- Float this Topic for Current User
- Bookmark
- Subscribe
- Mute
- Printer Friendly Page
- Mark as New
- Bookmark
- Subscribe
- Mute
- Subscribe to RSS Feed
- Permalink
- Report Inappropriate Content
Overlay selection and totals in bar graph
I want to create a single bar graph with live results overlayed in front of the static results for all data (i.e. ignoring selection). Basically in a single graph one will be able to see the selected data as a proportion of the total given the dimension. It is easy enough to create the two expressions but I can't seem to overlay them. In Excel I would simply set the overlap equal to 100%. Is there a way to do this in QV and I'm simply missing something simple?
Attached is an example QV file with the graph.
Accepted Solutions
- Mark as New
- Bookmark
- Subscribe
- Mute
- Subscribe to RSS Feed
- Permalink
- Report Inappropriate Content
- Mark as New
- Bookmark
- Subscribe
- Mute
- Subscribe to RSS Feed
- Permalink
- Report Inappropriate Content
Are you looking for something like this?

- Mark as New
- Bookmark
- Subscribe
- Mute
- Subscribe to RSS Feed
- Permalink
- Report Inappropriate Content
Hi,
maybe you could use the "Set Reference" option of your bar chart?:
hope this helps
regards
Marco
- Mark as New
- Bookmark
- Subscribe
- Mute
- Subscribe to RSS Feed
- Permalink
- Report Inappropriate Content
It might be picky of me, but the pop-up totals are showing the difference and not the actual total, but the effect is exactly what I'm looking for.
Thanks
- Mark as New
- Bookmark
- Subscribe
- Mute
- Subscribe to RSS Feed
- Permalink
- Report Inappropriate Content
This could work, but the data gets updated monthly and I'll have large number of graphs to set the reference each time.
But I did learn something new, thanks!
- Mark as New
- Bookmark
- Subscribe
- Mute
- Subscribe to RSS Feed
- Permalink
- Report Inappropriate Content
May be use a popup text expression
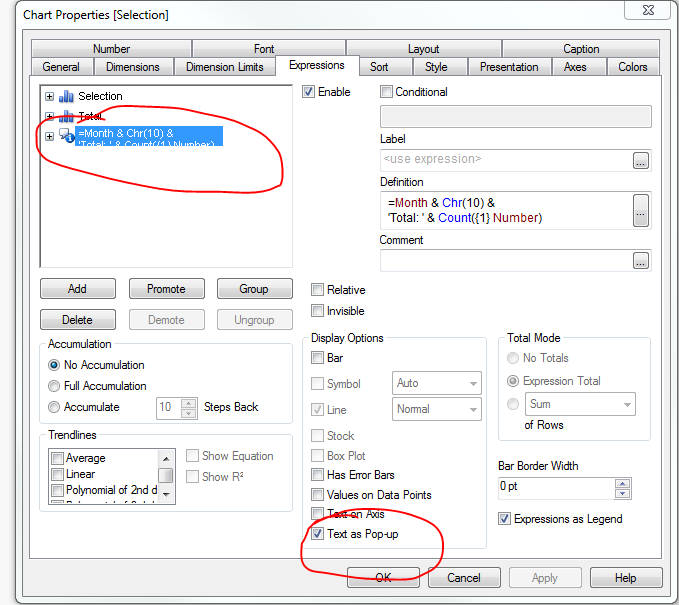
But make sure you uncheck 'Pop-up Labels' on the presentation tab....