Unlock a world of possibilities! Login now and discover the exclusive benefits awaiting you.
- Qlik Community
- :
- All Forums
- :
- QlikView App Dev
- :
- Partial Total of single field
- Subscribe to RSS Feed
- Mark Topic as New
- Mark Topic as Read
- Float this Topic for Current User
- Bookmark
- Subscribe
- Mute
- Printer Friendly Page
- Mark as New
- Bookmark
- Subscribe
- Mute
- Subscribe to RSS Feed
- Permalink
- Report Inappropriate Content
Partial Total of single field
Hello everyone,
This is the first time I'm writting on this forum. Hope you will help me.
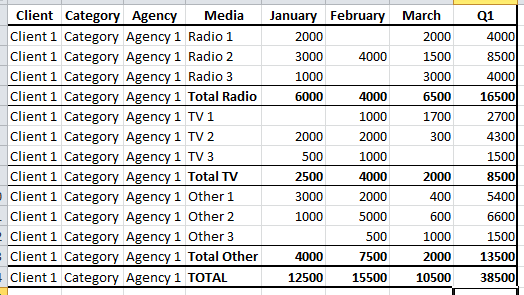
I load table from Excel in QlikView, and I load only atomic data without field that contain formula. I want to create totals like in the table below (Total Radio, Total TV, Total Other), but I don't know how to create partial totals, and what type of chart to use in this situation. Should I use Straight Table or Pivot Table. Do I need to group values of field to get Total value or something else. Any help is welcome.
And one more question, how to load empty cell from Excel, I think he skip that cell if there's not value.
Thanks 
Accepted Solutions
- Mark as New
- Bookmark
- Subscribe
- Mute
- Subscribe to RSS Feed
- Permalink
- Report Inappropriate Content
the checkbox Show Partial Sum in Presentation tab of Pivot chart can help you
but you need a field to group the 3 different group Radio, .....
- Mark as New
- Bookmark
- Subscribe
- Mute
- Subscribe to RSS Feed
- Permalink
- Report Inappropriate Content
the checkbox Show Partial Sum in Presentation tab of Pivot chart can help you
but you need a field to group the 3 different group Radio, .....
- Mark as New
- Bookmark
- Subscribe
- Mute
- Subscribe to RSS Feed
- Permalink
- Report Inappropriate Content
The best solution is a pivot table where in presentation you vìcan list dimensional filds and have for them partial sum.
When you load fron excel, if you have blank fields and you need to populate them with some value, the suggestion I give to you is to reload (with noconcatenate) and setting some if for the fiels
For example
TabOrig.:
Load * from myXls;
NewTab:
noconcatenate
load
field1,
...
if(isnull(fieldn), myval, fieldn) as fieldn
resident TabOrig;
drop table TabOrig;
hope it helps