Unlock a world of possibilities! Login now and discover the exclusive benefits awaiting you.
- Qlik Community
- :
- All Forums
- :
- QlikView App Dev
- :
- Percent change combo chart
- Subscribe to RSS Feed
- Mark Topic as New
- Mark Topic as Read
- Float this Topic for Current User
- Bookmark
- Subscribe
- Mute
- Printer Friendly Page
- Mark as New
- Bookmark
- Subscribe
- Mute
- Subscribe to RSS Feed
- Permalink
- Report Inappropriate Content
Percent change combo chart
Hello all,
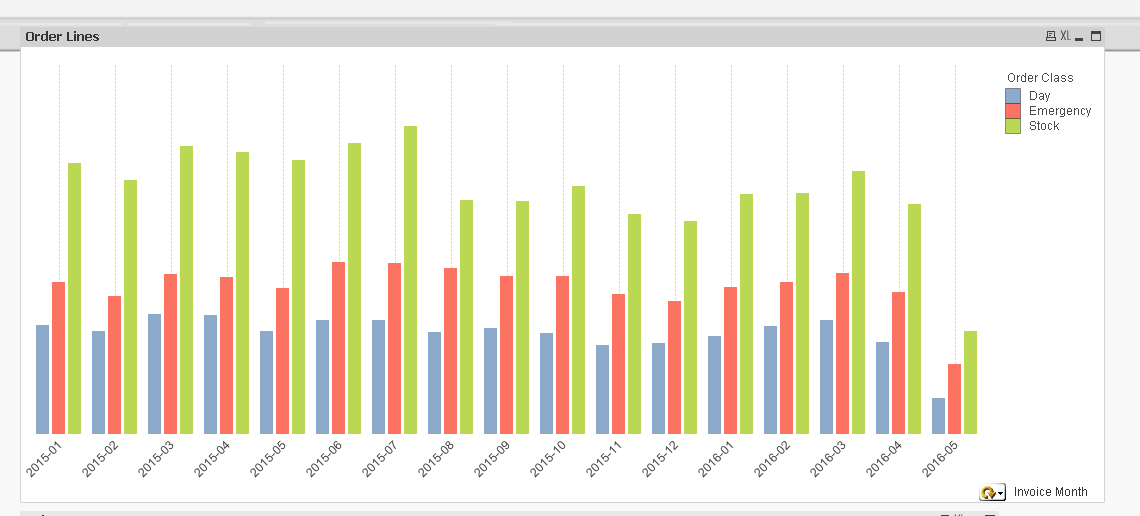
I am wondering if anyone can assist me with creating a percent change line from month to month in my combo chart. I dont know either since the order class is broken out if it's possible to just get one line that only focuses on the totals rather than three individual lines of percent change based on the 3 order classes. I also ran in to issues at one point where the percent change only occurred between the three bars in one particular month and did not do month to month.
I have variables for my date ranges which are the following:
Last Month: V_LM
Current Month: VMax_CY
Also listed these to help.
Dimension: =if(OrderClassSummary<>' ',OrderClassSummary,)
Expression: sum([Order Line Unique])
Thanks in advance for your time and help.