Unlock a world of possibilities! Login now and discover the exclusive benefits awaiting you.
- Qlik Community
- :
- All Forums
- :
- QlikView App Dev
- :
- Pie Chart graph filtered for Top 10
- Subscribe to RSS Feed
- Mark Topic as New
- Mark Topic as Read
- Float this Topic for Current User
- Bookmark
- Subscribe
- Mute
- Printer Friendly Page
- Mark as New
- Bookmark
- Subscribe
- Mute
- Subscribe to RSS Feed
- Permalink
- Report Inappropriate Content
Pie Chart graph filtered for Top 10
Hi,
I have my pie chart that filters for top 10 according to revenue (sum(revenue) for a Product.
How do I make a pie chart that filters for two expressions?
So sum(revenue) and sum(orders) for Product (dimension)?
In the dimension limits you can only choose top 10 products for one expression...
I want the top 10 Products by sum(revenue) and by sum(orders)?
Accepted Solutions
- Mark as New
- Bookmark
- Subscribe
- Mute
- Subscribe to RSS Feed
- Permalink
- Report Inappropriate Content
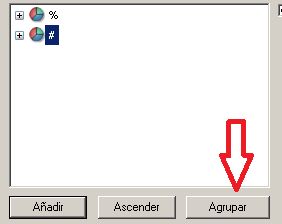
Hi you can create two expressions, select the bottom expression the 'Group' button will be active:

Int he chart you'll see the  icon, where the user can select the expression. The dimension limits works with the active expression selected by user.
- Mark as New
- Bookmark
- Subscribe
- Mute
- Subscribe to RSS Feed
- Permalink
- Report Inappropriate Content
Hi you can create two expressions, select the bottom expression the 'Group' button will be active:

Int he chart you'll see the  icon, where the user can select the expression. The dimension limits works with the active expression selected by user.
- Mark as New
- Bookmark
- Subscribe
- Mute
- Subscribe to RSS Feed
- Permalink
- Report Inappropriate Content
Hi,
Is this something you can do, based upon your data? How would you imagine it? I can imagine quite some issues in defining rules. e.g. a cheap product that gets a lot of orders vs an expensive one that gets much lower offers so that revenue is similar (and should be in top 10). How would you deal with this? Imagining you have other products that make up the top 10 in order lines apart from the expensive one.
My solution would be to have 2 different pie charts in a container instead of wanting to combine them in one chart.
Kind regards,
Johan