Unlock a world of possibilities! Login now and discover the exclusive benefits awaiting you.
- Qlik Community
- :
- All Forums
- :
- QlikView App Dev
- :
- Re: Pie Chart or Gauge Chart
- Subscribe to RSS Feed
- Mark Topic as New
- Mark Topic as Read
- Float this Topic for Current User
- Bookmark
- Subscribe
- Mute
- Printer Friendly Page
- Mark as New
- Bookmark
- Subscribe
- Mute
- Subscribe to RSS Feed
- Permalink
- Report Inappropriate Content
Pie Chart or Gauge Chart
Hi,
I have a question, i have a data consists of 3 column (GROUP, BRAND, QUANTITY)
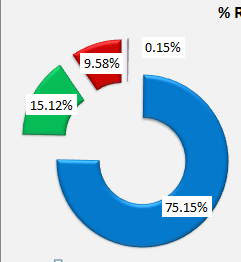
I want to create a chart like this:

i want to calculate the percentage of Group. Sum(Quantity)/Sum(total Quantity) %
Is it possible to create that kind of chart ?
I also attach my sample data.
thanks in advance.
Accepted Solutions
- Mark as New
- Bookmark
- Subscribe
- Mute
- Subscribe to RSS Feed
- Permalink
- Report Inappropriate Content
Yes its possible .
Go to the Expression Tab. Under the Expression you created, there is + sign , expand this and you will see a Pie Popout option. Select this option and enter an expression such as sum(your expression) > 0 or simply add 1
- Mark as New
- Bookmark
- Subscribe
- Mute
- Subscribe to RSS Feed
- Permalink
- Report Inappropriate Content
Yes its possible, I would suggest use Pie chart for the same. But note you can use a max of 2 dimension so that the chart representation would be clear
- Mark as New
- Bookmark
- Subscribe
- Mute
- Subscribe to RSS Feed
- Permalink
- Report Inappropriate Content
Hi Avinash,
Thanks for reply.
Yes i only use one dimension (GROUP dimension).
I've try using pie chart. but is it possible to separate each group like that ?
Thanks
- Mark as New
- Bookmark
- Subscribe
- Mute
- Subscribe to RSS Feed
- Permalink
- Report Inappropriate Content
Yes its possible .
Go to the Expression Tab. Under the Expression you created, there is + sign , expand this and you will see a Pie Popout option. Select this option and enter an expression such as sum(your expression) > 0 or simply add 1
- Mark as New
- Bookmark
- Subscribe
- Mute
- Subscribe to RSS Feed
- Permalink
- Report Inappropriate Content
Wow,
thanks Avinash for your suggestion,
It solved my problem perfectly.
Thanks once again.
- Mark as New
- Bookmark
- Subscribe
- Mute
- Subscribe to RSS Feed
- Permalink
- Report Inappropriate Content
cool ![]()