Unlock a world of possibilities! Login now and discover the exclusive benefits awaiting you.
- Qlik Community
- :
- All Forums
- :
- QlikView App Dev
- :
- Re: Re: Pie chart not showing properly
- Subscribe to RSS Feed
- Mark Topic as New
- Mark Topic as Read
- Float this Topic for Current User
- Bookmark
- Subscribe
- Mute
- Printer Friendly Page
- Mark as New
- Bookmark
- Subscribe
- Mute
- Subscribe to RSS Feed
- Permalink
- Report Inappropriate Content
Pie chart not showing properly
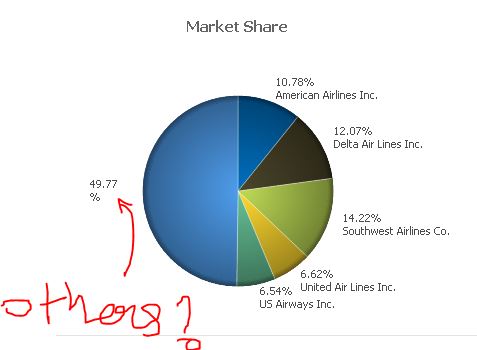
I followed the instructions to create a slice called "others" as per the instructions in my book. But, I don't see "others" next to the percentage for "others" group.

Instructions -
1. Right-click on the pie chart and select Properties….
2. Go to the Expressions tab, and select Add to add a new expression.
3. Enter the following expression:
if(count(distinct [Carrier Name]) = 1, [Carrier Name], 'Others')
4. For the Label field of the expression, enter Carrier and enable the Values on
Data Points option.
- « Previous Replies
-
- 1
- 2
- Next Replies »
- Mark as New
- Bookmark
- Subscribe
- Mute
- Subscribe to RSS Feed
- Permalink
- Report Inappropriate Content
Can u attach ur sample QVW file?
- Mark as New
- Bookmark
- Subscribe
- Mute
- Subscribe to RSS Feed
- Permalink
- Report Inappropriate Content
hi
in properties dimensions limits tab enable show others...
hope it helps
- Mark as New
- Bookmark
- Subscribe
- Mute
- Subscribe to RSS Feed
- Permalink
- Report Inappropriate Content
Follow below steps....
Create a Pie Chart
Dimension
[Carrier Name]
Dimension Limit
Tick Restrict Which Values are Displayed Using the First Expression
Show Only Values that Accumulate to
50% Relative to the Total Use Largest Value
Tick Include Boundary Values
Tick Show Others
Expression (Two Expressions)
SUM([# Transported Passengers])
Tick Values on Data Points
IF(Count(DISTINCT [Carrier Name])=1, [Carrier Name],'Others')
Tick Values on Data Points
- Mark as New
- Bookmark
- Subscribe
- Mute
- Subscribe to RSS Feed
- Permalink
- Report Inappropriate Content
HI ,
I guess it won't show you the label ,As Values on Data Points only give the values and lemme now if labels with values are possible.
Thanks
Saurabh
- Mark as New
- Bookmark
- Subscribe
- Mute
- Subscribe to RSS Feed
- Permalink
- Report Inappropriate Content
Try it and let me know !!![]()
- Mark as New
- Bookmark
- Subscribe
- Mute
- Subscribe to RSS Feed
- Permalink
- Report Inappropriate Content
Dear Manish,
I tried but it wasn't showing the labels.. its showing only values..
Could you Pls share the sample Qvw in which i can see the both .
Thanks ..
- Mark as New
- Bookmark
- Subscribe
- Mute
- Subscribe to RSS Feed
- Permalink
- Report Inappropriate Content
Check enclosed file..
- Mark as New
- Bookmark
- Subscribe
- Mute
- Subscribe to RSS Feed
- Permalink
- Report Inappropriate Content
Thanks alot Manish ![]()
- Mark as New
- Bookmark
- Subscribe
- Mute
- Subscribe to RSS Feed
- Permalink
- Report Inappropriate Content
In presentation tab, I had unchecked show legend because I only wanted to see the pie. I still don't know why there is no 'others' next to that 49%. I am attaching my qvw file. Please help me to make it work.
Thanks.
- « Previous Replies
-
- 1
- 2
- Next Replies »