Unlock a world of possibilities! Login now and discover the exclusive benefits awaiting you.
- Qlik Community
- :
- All Forums
- :
- QlikView App Dev
- :
- Re: Pie chart overlay subtitles. How to solve?
- Subscribe to RSS Feed
- Mark Topic as New
- Mark Topic as Read
- Float this Topic for Current User
- Bookmark
- Subscribe
- Mute
- Printer Friendly Page
- Mark as New
- Bookmark
- Subscribe
- Mute
- Subscribe to RSS Feed
- Permalink
- Report Inappropriate Content
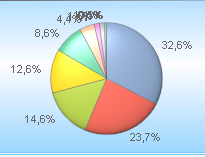
Pie chart overlay subtitles. How to solve?
Hi! any ideia?

- Mark as New
- Bookmark
- Subscribe
- Mute
- Subscribe to RSS Feed
- Permalink
- Report Inappropriate Content
Hi,
I think you can add dimension limites (with "Show Others" option) to restrict to 4 or 5 segments. Or change to a bar chart.
Regards
Aurélien
- Mark as New
- Bookmark
- Subscribe
- Mute
- Subscribe to RSS Feed
- Permalink
- Report Inappropriate Content
Marco
Some people whom I hold in high regard [and agree with] believe that Pie Charts are ineffective visualisation.
A simple table or bar chart could well be visually more effective at conveying the meaning & implications of the data.
Stephen Few is well known for his work on visualisation, I suggest you google Stephen Few Pie Chart and read his views on the matter.
Best Regards, Bill
- Mark as New
- Bookmark
- Subscribe
- Mute
- Subscribe to RSS Feed
- Permalink
- Report Inappropriate Content
From : QlikView For Developers CookBook
Follow these steps to create a pie chart with staggered labels:
1. Create a new pie chart.
2. Add Country as the dimension.
3. On the Expressions tab, add the following expression:
Dual(
Country & '-' &
Num(sum(Sales), '#,##0') &
Repeat(chr(13)&chr(10), rank(Sum(Sales))-6),
sum(Sales)
)
4. Select the Values on Data Points option.
5. On the Sort tab, select the Y-Value option. Confirm Descending as
the direction.
6. On the Presentation tab, deselect the Show Legend option.
- Mark as New
- Bookmark
- Subscribe
- Mute
- Subscribe to RSS Feed
- Permalink
- Report Inappropriate Content
Try with Ctrl + Alt to resize your graphs
- Mark as New
- Bookmark
- Subscribe
- Mute
- Subscribe to RSS Feed
- Permalink
- Report Inappropriate Content
Hi Marco,
Like best practice in data visualization for a pie chart, You could show 4 or 5 elements and use the option Others.
Chart properties --> Dimention limits --> Options -> Show Others.
Regards,
- Mark as New
- Bookmark
- Subscribe
- Mute
- Subscribe to RSS Feed
- Permalink
- Report Inappropriate Content
Tks Aurélien Martinez, i know that, but, my client not like.
- Mark as New
- Bookmark
- Subscribe
- Mute
- Subscribe to RSS Feed
- Permalink
- Report Inappropriate Content
Tks, Bill!
I liked this (http://www.perceptualedge.com/articles/08-21-07.pdf) article, very usefull. I read, but, i need more time to apply in my applications.
- Mark as New
- Bookmark
- Subscribe
- Mute
- Subscribe to RSS Feed
- Permalink
- Report Inappropriate Content
Tks! I will try this.