Unlock a world of possibilities! Login now and discover the exclusive benefits awaiting you.
- Qlik Community
- :
- All Forums
- :
- QlikView App Dev
- :
- Pie chart with number and percent
- Subscribe to RSS Feed
- Mark Topic as New
- Mark Topic as Read
- Float this Topic for Current User
- Bookmark
- Subscribe
- Mute
- Printer Friendly Page
- Mark as New
- Bookmark
- Subscribe
- Mute
- Subscribe to RSS Feed
- Permalink
- Report Inappropriate Content
Pie chart with number and percent
Hi
I have 2 fields namely _Chart1Expression3 and _Chart1Expression2 that correspond to the metric in integer (Million scaling) and percent format.
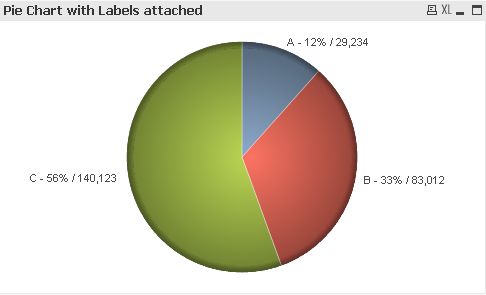
I would like to display both of them in the pie chart using the technique below, however the Chart Legend only displays the numeric portion of the Show Numbers in Legend and not the Text Representation. Is there something I am missing?
dual($($(=_Chart1Expression3)) & ' M / ' & $($(=_Chart1Expression2)), $($(=_Chart1Expression3)))
_Chart1Expression3 = Num(SUM(Metric)/1000000, '#,##0')
_Chart1Expression2 = Num(SUM(Metric)/SUM(Total Metric), '#,##0%')
- « Previous Replies
-
- 1
- 2
- Next Replies »
- Mark as New
- Bookmark
- Subscribe
- Mute
- Subscribe to RSS Feed
- Permalink
- Report Inappropriate Content
unfortunately they are not. they are workarounds to the problem i have. it seems this might be a bug as Nag Aviral's solution has the same defect as mine and the others are not what I am looking for.
- Mark as New
- Bookmark
- Subscribe
- Mute
- Subscribe to RSS Feed
- Permalink
- Report Inappropriate Content
I see I misunderstood the question. I wouldn't agree it's a bug. The property on the Presentation/Legend is "Show Numbers in Legend". It is correctly showing the number value, not the text. Your reference to the Month example was for the legend Label - not the value -- which is correctly displayed as text.
-Rob
- Mark as New
- Bookmark
- Subscribe
- Mute
- Subscribe to RSS Feed
- Permalink
- Report Inappropriate Content
Well it is a bug in that it will not accept the NUM() function for the formatting even it has to show numeric representation of the data as opposed to text.
Hoep this elaborates better.
Having to show percent on the data point and numbers next to it or in legend affords poor readability.
It seems I will have to resort to Y-value sorted Bar Chart as an alternative to achieve the task. It would have been ideal if the Pie achieved the same result
- Mark as New
- Bookmark
- Subscribe
- Mute
- Subscribe to RSS Feed
- Permalink
- Report Inappropriate Content
Please see the Modified Attachment.
- Mark as New
- Bookmark
- Subscribe
- Mute
- Subscribe to RSS Feed
- Permalink
- Report Inappropriate Content
still not it
- Mark as New
- Bookmark
- Subscribe
- Mute
- Subscribe to RSS Feed
- Permalink
- Report Inappropriate Content
What exactly you Want. Be Clear & specific??
- Mark as New
- Bookmark
- Subscribe
- Mute
- Subscribe to RSS Feed
- Permalink
- Report Inappropriate Content
Hi Amir,
what about this solution:
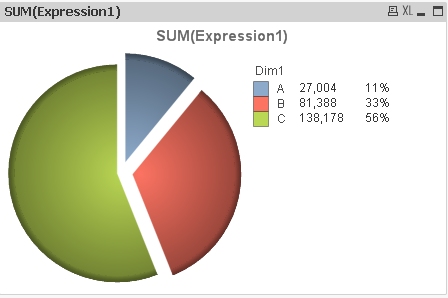
I looked at your test.qvw and found that, when using the dual function you'll get a result only, if in the 'Number' tab the check box 'Expression default' is marked. In this case the 'Show value in Legend' cannot show the result you want to see. So I unchecked the 'Show Legend' in the 'Presentation' tab and added the 'Dim1' field to the dual function. Also you have to check the 'Show Values on Datapoints' in the 'Expression' tab.
See below your modified qvw.
Enjoy
Burkhard
- Mark as New
- Bookmark
- Subscribe
- Mute
- Subscribe to RSS Feed
- Permalink
- Report Inappropriate Content
the only way you can have two numbers next to legend in a pie chart, in your case, a percent value and the actual number value of the expression next to each other in the legend is by creating a work around. the way i did it on my end for a very similar requirement is create a straight table with the same dimensions and expression as pie chart and align it right next to the legend with no borders. the pie chart legend can show the real numbers and straight table can show percentages or vice versa.
- Mark as New
- Bookmark
- Subscribe
- Mute
- Subscribe to RSS Feed
- Permalink
- Report Inappropriate Content
like this. since it is a straight table, it will still respond to your selections in pie chart or in the table and stay consistent..
1. in your pie chart, turn show numbers in legend off.
2. create a new straight table with same dimension as pie chart and two expressions - one for number and one for %.
3. in straight table, turn off borders (cell and table).
4. hide dimension column.
5. make sure your fonts are the same as legend and place the table right next to the pie chart legend and you have what you need.
- Mark as New
- Bookmark
- Subscribe
- Mute
- Subscribe to RSS Feed
- Permalink
- Report Inappropriate Content
Please see the attached file.
- « Previous Replies
-
- 1
- 2
- Next Replies »