Unlock a world of possibilities! Login now and discover the exclusive benefits awaiting you.
- Qlik Community
- :
- All Forums
- :
- QlikView App Dev
- :
- Pivottable to diagram (rangesum)
- Subscribe to RSS Feed
- Mark Topic as New
- Mark Topic as Read
- Float this Topic for Current User
- Bookmark
- Subscribe
- Mute
- Printer Friendly Page
- Mark as New
- Bookmark
- Subscribe
- Mute
- Subscribe to RSS Feed
- Permalink
- Report Inappropriate Content
Pivottable to diagram (rangesum)
Hello,
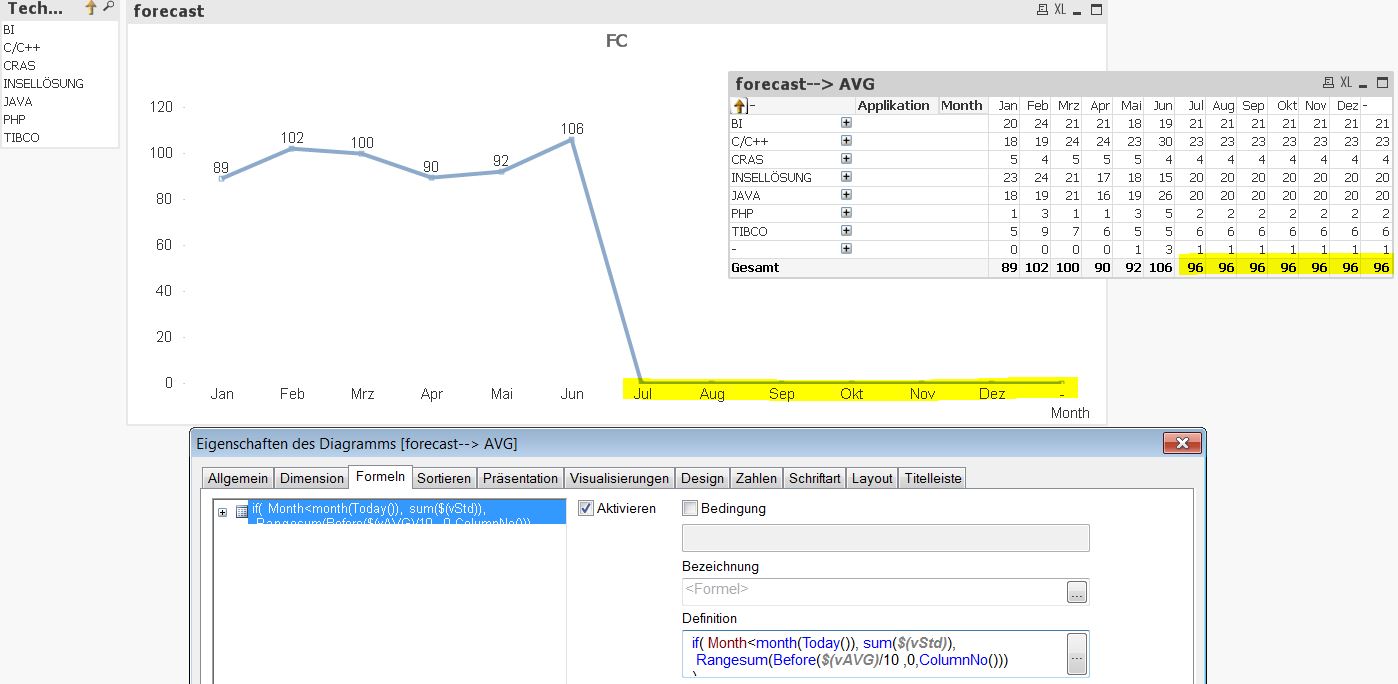
I have two problems with the visualization of a forecast - diagram.
The first one:
In the pivottable everything is correctly. Here I'm using following formel:
Rangesum(Before($(vAVG)/10 ,0,ColumnNo())))
In the diagram I'm using this formel and it shows me only the exist months:
if( Month<month(Today()), sum( $(vStd)),
Rangesum(Before($(vAVG) ,0,ColumnNo()))
)
The second problem, if I set the filter on Technology, for example "BI", then I get no values for the future month in diagram and also pivottable.
Can you please help me.
- « Previous Replies
-
- 1
- 2
- Next Replies »
- Mark as New
- Bookmark
- Subscribe
- Mute
- Subscribe to RSS Feed
- Permalink
- Report Inappropriate Content
Thank you very much !!! No, it was no question, it was additional information ! Kind regard, André
- Mark as New
- Bookmark
- Subscribe
- Mute
- Subscribe to RSS Feed
- Permalink
- Report Inappropriate Content
Awesome 
I am glad we were able to help you andrekab
- « Previous Replies
-
- 1
- 2
- Next Replies »