Unlock a world of possibilities! Login now and discover the exclusive benefits awaiting you.
- Qlik Community
- :
- All Forums
- :
- QlikView App Dev
- :
- Plant Operation Efficiency Measures
- Subscribe to RSS Feed
- Mark Topic as New
- Mark Topic as Read
- Float this Topic for Current User
- Bookmark
- Subscribe
- Mute
- Printer Friendly Page
- Mark as New
- Bookmark
- Subscribe
- Mute
- Subscribe to RSS Feed
- Permalink
- Report Inappropriate Content
Plant Operation Efficiency Measures
Hi, everybody!
I need to find a way to measure the efficiency of different groups in our plant based on sales and the number of hours worked. Some employees are dedicated to a product line while others belong to groups that support all product lines.
I have two different data sets, one has sales by product line by month and the other has hours worked by group.
| Prod Ln | Date | Sales |
|---|---|---|
| Product 1 | 6/1/2015 | 200000 |
| Product 2 | 6/1/2015 | 250000 |
| Product 1 | 7/1/2015 | 225000 |
| Product 2 | 7/1/2015 | 180000 |
| Product 1 | 8/1/2015 | 230000 |
| Product 2 | 8/1/2015 | 150000 |
| Group | Month | Hours Worked |
| Product 1 Employees | 06/01/2015 | 688 |
| Product 1 Employees | 07/01/2015 | 720 |
| Product 1 Employees | 08/01/2015 | 735 |
| Product 2 Employees | 06/01/2015 | 860 |
| Product 2 Employees | 07/01/2015 | 900 |
| Product 2 Employees | 08/01/2015 | 880 |
| Support Group A | 06/01/2015 | 344 |
| Support Group A | 07/01/2015 | 350 |
| Support Group A | 08/01/2015 | 320 |
| Support Group B | 06/01/2015 | 516 |
| Support Group B | 07/01/2015 | 530 |
| Support Group B | 08/01/2015 | 550 |
| Support Group C | 06/01/2015 | 172 |
| Support Group C | 07/01/2015 | 172 |
| Support Group C | 08/01/2015 | 172 |
The results that I'm looking to get would be like this where Product 1 Employees are measured against only Product Line 1 sales, but Support Group A is measured against the sum of Product 1 and Product Line 2 sales.
| Results | 06/01/2015 | 07/01/2015 | 08/01/2015 |
| Product 1 Employees | $ 290.70 | $ 312.50 | $ 312.93 |
| Product 2 Employees | $ 290.70 | $ 200.00 | $ 170.45 |
| Support Group A | $ 1,308.14 | $ 1,157.14 | $ 1,187.50 |
| Support Group B | $ 872.09 | $ 764.15 | $ 690.91 |
| Support Group C | $ 2,616.28 | $ 2,354.65 | $ 2,209.30 |
Does anyone know the the best way to build this in QlikView? Ideally the end user will click on just the Group they way to see the efficiency for and the expression will know whether to add just the product line sales or total sales.
The tables are attached in an Excel file.
Thanks for the help!
Justin
Accepted Solutions
- Mark as New
- Bookmark
- Subscribe
- Mute
- Subscribe to RSS Feed
- Permalink
- Report Inappropriate Content
Hi,
one solution in the front end keeping your data in seperate tables could be:
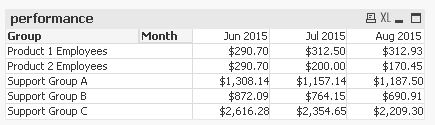

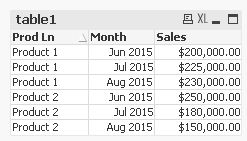
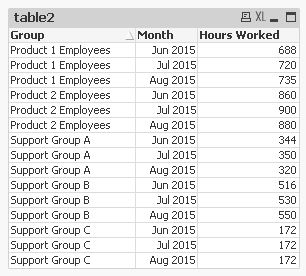
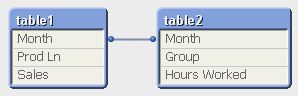
table1:
LOAD [Prod Ln],
     MonthName(Date) as Month,
     Sales
FROM [https://community.qlik.com/thread/167180] (html, codepage is 1252, embedded labels, table is @1);

table2:
LOAD Group,
     MonthName(Month) as Month,
     [Hours Worked]
FROM [https://community.qlik.com/thread/167180] (html, codepage is 1252, embedded labels, table is @2);
hope this helps
regards
Marco
- Mark as New
- Bookmark
- Subscribe
- Mute
- Subscribe to RSS Feed
- Permalink
- Report Inappropriate Content
Is this what you are looking for?
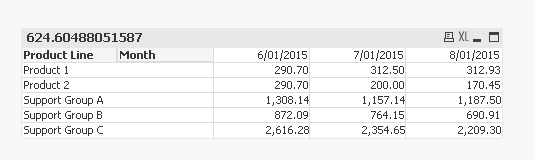
If yes, you can use the following script:
Table:
LOAD Capitalize(Group) as [Product Line],
Month,
[Hours Worked]
FROM
Community_167180.xlsx
(ooxml, embedded labels, table is Sheet3);
Join(Table)
LOAD Capitalize([Product Line]) as [Product Line],
Month,
Sales
FROM
Community_167180.xlsx
(ooxml, embedded labels, table is Sheet2);
Join(Table)
LOAD Month,
Sum(Sales) as Sales1
FROM
Community_167180.xlsx
(ooxml, embedded labels, table is Sheet2)
Group By Month;
and then create a pivot table with Product line and Month as dimension and the following expression:
=Sum(Alt(Sales, Sales1))/Sum([Hours Worked])
Please find attached the qvw file for reference also.
Best,
Sunny
- Mark as New
- Bookmark
- Subscribe
- Mute
- Subscribe to RSS Feed
- Permalink
- Report Inappropriate Content
Hi,
one solution in the front end keeping your data in seperate tables could be:
table1:
LOAD [Prod Ln],
     MonthName(Date) as Month,
     Sales
FROM [https://community.qlik.com/thread/167180] (html, codepage is 1252, embedded labels, table is @1);

table2:
LOAD Group,
     MonthName(Month) as Month,
     [Hours Worked]
FROM [https://community.qlik.com/thread/167180] (html, codepage is 1252, embedded labels, table is @2);
hope this helps
regards
Marco
- Mark as New
- Bookmark
- Subscribe
- Mute
- Subscribe to RSS Feed
- Permalink
- Report Inappropriate Content
Thanks!
- Mark as New
- Bookmark
- Subscribe
- Mute
- Subscribe to RSS Feed
- Permalink
- Report Inappropriate Content
Thanks, Marco!
- Mark as New
- Bookmark
- Subscribe
- Mute
- Subscribe to RSS Feed
- Permalink
- Report Inappropriate Content
You're welcome
regards
Marco