Unlock a world of possibilities! Login now and discover the exclusive benefits awaiting you.
Announcements
Qlik Connect 2025: 3 days of full immersion in data, analytics, and AI. May 13-15 | Orlando, FL:
Learn More
- Qlik Community
- :
- All Forums
- :
- QlikView App Dev
- :
- Please help regarding following chart !!
Options
- Subscribe to RSS Feed
- Mark Topic as New
- Mark Topic as Read
- Float this Topic for Current User
- Bookmark
- Subscribe
- Mute
- Printer Friendly Page
Turn on suggestions
Auto-suggest helps you quickly narrow down your search results by suggesting possible matches as you type.
Showing results for
Specialist II
2014-10-10
02:58 AM
- Mark as New
- Bookmark
- Subscribe
- Mute
- Subscribe to RSS Feed
- Permalink
- Report Inappropriate Content
Please help regarding following chart !!
HEy,
I am attaching sample of my application.
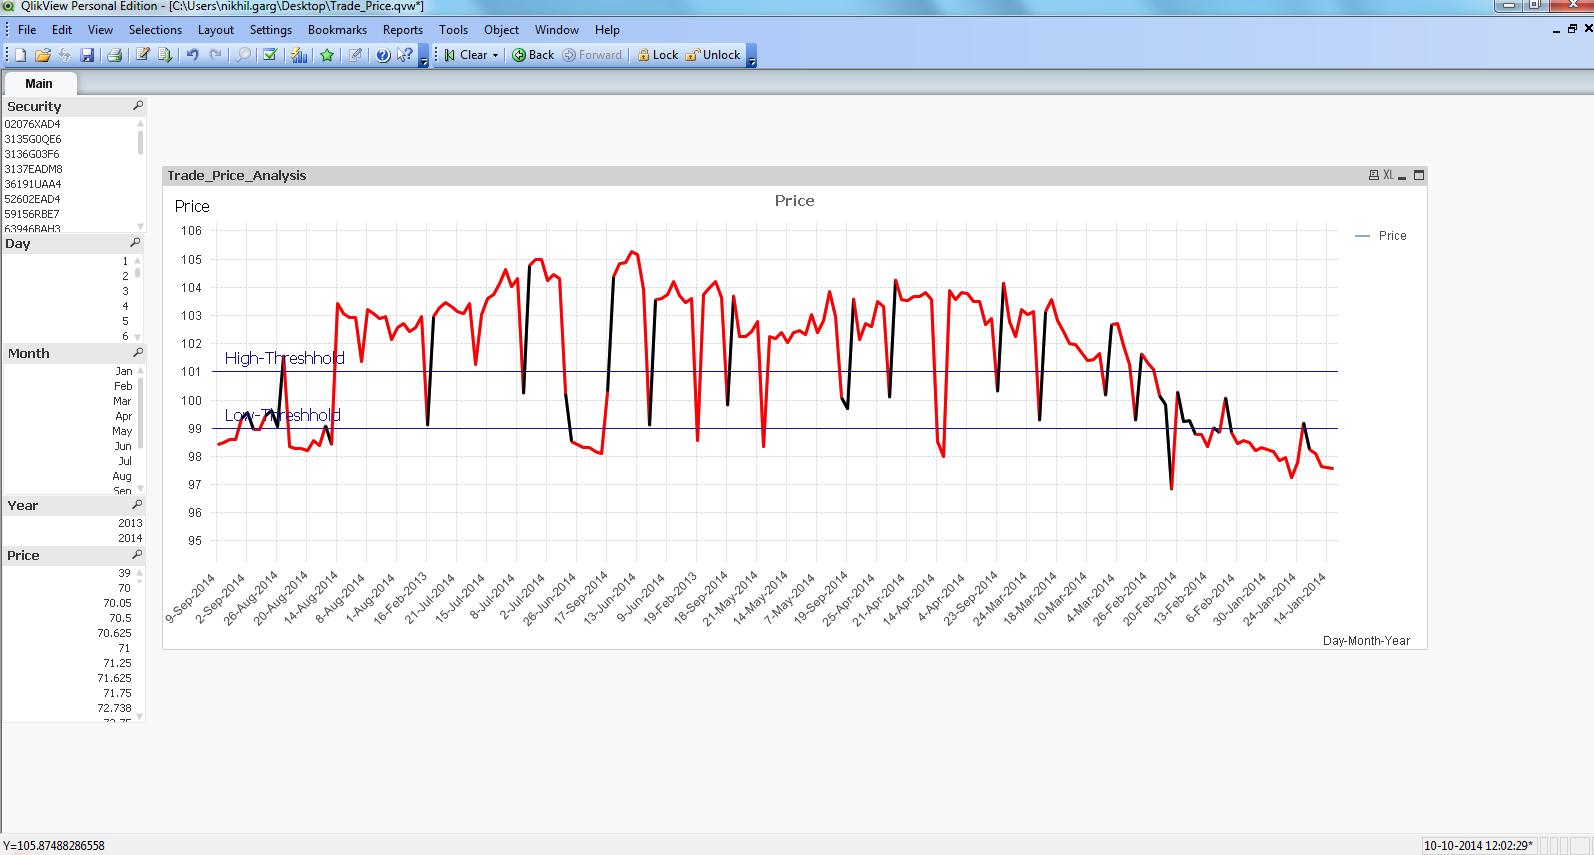
In this when no field or no selection is made , graph is as shown in Capture2.png.
When i select Security, Month and year graph is as in Capture1.png.
I want my chart in Capture2.png(when no selection is made) to be shown like Capture1.png.
Please tell how to do this???
Thanks.
- Tags:
- new_to_qlikview
181 Views
0 Replies