Unlock a world of possibilities! Login now and discover the exclusive benefits awaiting you.
- Qlik Community
- :
- All Forums
- :
- QlikView App Dev
- :
- Plot a graph on daily basis based on range of date...
- Subscribe to RSS Feed
- Mark Topic as New
- Mark Topic as Read
- Float this Topic for Current User
- Bookmark
- Subscribe
- Mute
- Printer Friendly Page
- Mark as New
- Bookmark
- Subscribe
- Mute
- Subscribe to RSS Feed
- Permalink
- Report Inappropriate Content
Plot a graph on daily basis based on range of dates
Hi,
Need help on achieving on one of the requirements.
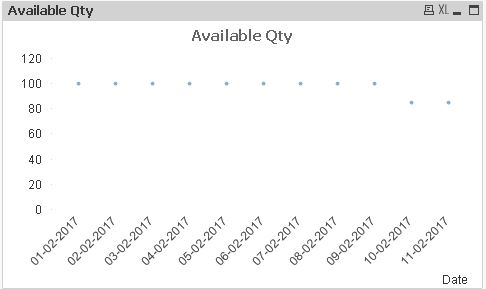
In the attached excel file we have set of attributes which provides the information of the Inventory. Consider a single row from the attached file, there is a sale happened on "01-02-2017" as shown in the BCAdjDate column and the final effective quantity is 100, this is available quantity till next date of BCAdjDate i.e. "10-02-2017". Here we needs to plot a graph w.r.t the date of all days including the dates which are not existed in the data; ex: For above described rows needs to plot a graph as shown in the below image.
Excel attached is the sample data, but real-time we have huge amount of Inventory data (approx : 10 million rows) in DB that we need to fetch into QVW file. So we are trying for the appropriate solution that will not create any performance or memory issues to achieve this solution.
[Note : We have multiple buckets for each month, and all those buckets should be considered for the entire month.]
Please suggest your ideas on achieving. We really appreciate for any quick response.
Thanks,
Chenna.