Unlock a world of possibilities! Login now and discover the exclusive benefits awaiting you.
- Qlik Community
- :
- All Forums
- :
- QlikView App Dev
- :
- Plot with 3 dimensions: How can we add a scrollbar...
- Subscribe to RSS Feed
- Mark Topic as New
- Mark Topic as Read
- Float this Topic for Current User
- Bookmark
- Subscribe
- Mute
- Printer Friendly Page
- Mark as New
- Bookmark
- Subscribe
- Mute
- Subscribe to RSS Feed
- Permalink
- Report Inappropriate Content
Plot with 3 dimensions: How can we add a scrollbar?
Hello,
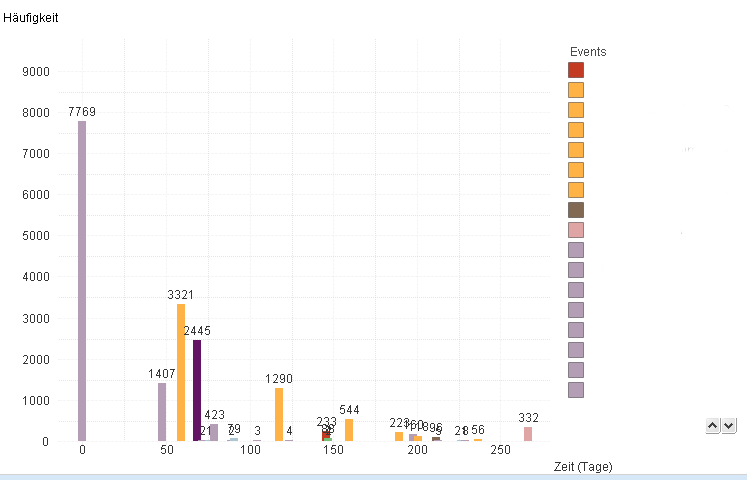
we have a custom plot. It has 2 dimensions (x-axis) and 1 formula (y-axis).
The first dimension for the x-axis defines the days after which an event in median occures. So what this means is:
If we have an event: Graduation, and we have 20 Graduations than this dimension gives us e.g. 200 days which is the median amount of days needed to get a graduation.
=ROUND(AGGR(MEDIAN(Days), Events))
The x-axis also has a second dimension. Which is just events. Different types like "graduation", "first exam".
So in general: Every bar we see is an event and it is located at the median time when it occures.
The y-axis now shows us how often the event occurs:
It is just modeled as a expression/formular in the chart tab: = COUNT(Events)
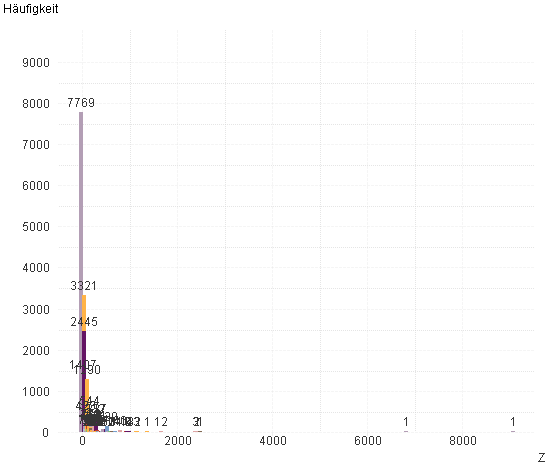
Now the problem is, that we have some events which occur in median very late. Thus, since we use a continuous day-axis (x-axis), the graph gets really messy.
What we would love to do is to zoom into the first ~100 days and then have an x-axis scroll bar, so that we focus the more important events but know that there are some events later on as well, and we can use the scroll bar to scroll there.

Now we can zoom into the plot by draging a boarder and selecting with the mouse but still there is no scrollbar.

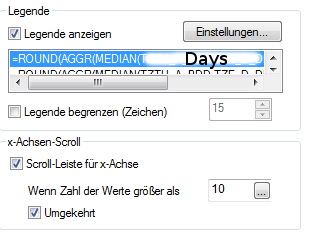
Now of course we know that there exists a scroll bar option in the custom chart-options where we can add a scrollbar to the x-axis.

Now even if we add this scrollbar, it does not work!!! The problem might be, that our x-axis is a combination of 2 dimensions - but anyways - there should be a solution, right?
So if anyone knows how we can add a scrollbar at our x-axis we would highly apreciate your input and suggestions.