Unlock a world of possibilities! Login now and discover the exclusive benefits awaiting you.
- Qlik Community
- :
- All Forums
- :
- QlikView App Dev
- :
- Re: Poor Performance: 16GB RAM, 200,000 KB QVW fil...
- Subscribe to RSS Feed
- Mark Topic as New
- Mark Topic as Read
- Float this Topic for Current User
- Bookmark
- Subscribe
- Mute
- Printer Friendly Page
- Mark as New
- Bookmark
- Subscribe
- Mute
- Subscribe to RSS Feed
- Permalink
- Report Inappropriate Content
Poor Performance: 16GB RAM, 200,000 KB QVW file, 30M rows, 3 columns
I have a blank QVW canvas loaded with only one table's data:
- 30M rows
- 3 columns
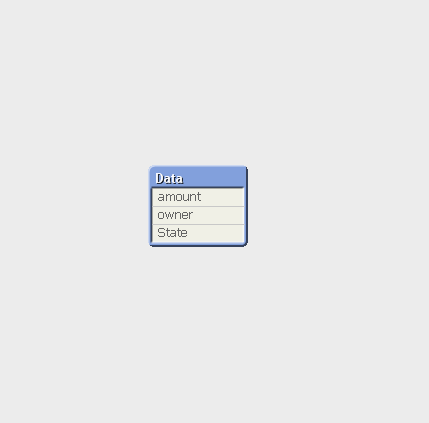
Here are the columns:
Here are the memory statistics:
| Class | Type | SubType | Id | Bytes | Count | Size | CalcTime | AvgCalcTime |
| Variable | Variable | Internal | CD | |||||
| Variable | Variable | Internal | QvPath | |||||
| Variable | Variable | Internal | QvRoot | |||||
| Variable | Variable | Internal | QvWorkPath | |||||
| Variable | Variable | Internal | QvWorkRoot | |||||
| Variable | Variable | Internal | WinPath | |||||
| Variable | Variable | Internal | WinRoot | |||||
| Variable | Variable | Internal | ErrorMode | |||||
| Variable | Variable | Internal | StripComments | |||||
| Variable | Variable | Internal | OpenUrlTimeout | |||||
| Variable | Variable | Internal | ScriptErrorCount | |||||
| Variable | Variable | Internal | ScriptErrorList | |||||
| Variable | Variable | Internal | ScriptError | |||||
| Database | Table | Records | Data | 179206446 | 29867741 | 6 | ||
| Database | Table | Records | $$SysTable 1 | 3 | 3 | 1 | ||
| Database | Table | Records | $$SysTable 2 | 1 | 1 | 1 | ||
| Database | Table | Records | $$SysTable 3 | 3 | 3 | 1 | ||
| Database | Field | Symbols | $Field | 34 | 3 | 11.33 | ||
| Database | Field | Symbols | $Table | 10 | 1 | 10 | ||
| Database | Field | Symbols | $Rows | 18 | 1 | 18 | ||
| Database | Field | Symbols | $Fields | 11 | 1 | 11 | ||
| Database | Field | Symbols | $FieldNo | 33 | 3 | 11 | ||
| Database | Field | Symbols | $Info | 6 | 1 | 6 | ||
| Database | Field | Symbols | amount | 254824 | 31853 | 8 | ||
| Database | Field | Symbols | owner | 426355655 | 20214495 | 21.09 | ||
| Database | Field | Symbols | State | 72 | 9 | 8 | ||
| State Space | Table State | Internal | Data | 29867741 | ||||
| State Space | Table State | Internal | $$SysTable 1 | 3 | ||||
| State Space | Table State | Internal | $$SysTable 2 | 1 | ||||
| State Space | Table State | Internal | $$SysTable 3 | 3 | ||||
| State Space | Field State | State | $Field | 3 | 1 | 3 | ||
| State Space | Field State | Selection | $Field | 0 | ||||
| State Space | Field State | State | $Table | 1 | 1 | 1 | ||
| State Space | Field State | Selection | $Table | 0 | ||||
| State Space | Field State | State | $Rows | 1 | 1 | 1 | ||
| State Space | Field State | Selection | $Rows | 0 | ||||
| State Space | Field State | State | $Fields | 1 | 1 | 1 | ||
| State Space | Field State | Selection | $Fields | 0 | ||||
| State Space | Field State | State | $FieldNo | 3 | 1 | 3 | ||
| State Space | Field State | Selection | $FieldNo | 0 | ||||
| State Space | Field State | State | $Info | 1 | 1 | 1 | ||
| State Space | Field State | Selection | $Info | 0 | ||||
| State Space | Field State | State | amount | 31853 | 1 | 31853 | ||
| State Space | Field State | Selection | amount | 0 | ||||
| State Space | Field State | State | owner | 20214495 | 1 | 20214495 | ||
| State Space | Field State | Selection | owner | 0 | ||||
| State Space | Field State | State | State | 9 | 1 | 9 | ||
| State Space | Field State | Selection | State | 0 |
My machine has 16GB of RAM.
The file is ~ 200,000 KB
The data is loaded from a simple load-script which takes a reasonable amount of time
So I have the data and a blank Qlikview canvas.... lovely:
I add a Chart:
Dimension : owner
Expression : SUM(Amount)
Dimension Limit : Top 10, or maybe Top 20... Very small subset
When I press "OK" on the CHart it may render, or it may (crashes due to Memory Allocation Exceeded, or "failed to draw chart")
If it renders, it takes a lengthy delay, between 2 and 8 minutes.
Once it renders, re-sorting descending vs ascending will cause another lengthy delay. Or it crashes.
I assume any other Qlikview activities would also be unbearably slow (filtering/making a selection, exporting to Excel, etc)
While it tries to render, my Task Manager shows Memory varying between 11.5 GB and the 16GB max (If Qlikview is closed, it hovers ~ 8GB)
And it sees CPU Usage varying between 50% and 100% (if Qlikview is closed it hovers ~ 40%)
- The table model is super-simple, so I don't think I can make improvements there.
- The canvas would have only one single Straight Table chart on it (with Dimension Limits!), so I don't think I have too many sheet objects. (Note: The memory statistics from above probably don't include any chart objects, because when I try to add a chart, it's either too slow or it crashes)
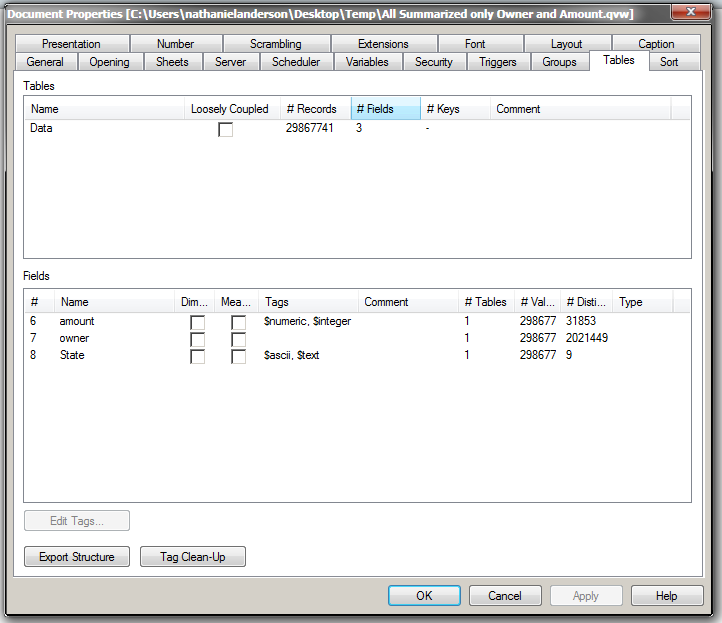
- Can any of the options on the Document Properties > Tables tab help me?
- How can I understand what's taking so long?
- General questions: What is CPU Usage and why is CPU Usage spiking if I have more Physical Memory it could use (instead? of CPU?) ?
- This data did come from a SQL Database (View). Can I tell you anything about that View? Can I use Qlikview "Direct Discovery" to reduce the processing on my computer, and instead make the Database do the processing?
I can accept that "well, it's just too much data for your simple/weak personal computer!" if that is the answer, I thought 16GB of RAM was quite powerful, but maybe I'm wrong...
But I'm frustrated because me I've had a bigger table, like:
40M rows
10 columns
Which results in a bigger QVW file, like:
900,000 KB (almost 1GB)
And many more Sheet Objects on the canvas, including a chart, a search object.
... and it seems the bigger file was both faster and more stable than the smaller file ...
Any advice appreciated...
- Tags:
- qlikview performance
- « Previous Replies
- Next Replies »
- Mark as New
- Bookmark
- Subscribe
- Mute
- Subscribe to RSS Feed
- Permalink
- Report Inappropriate Content
That´s the point we are discussing the trade-off
- Mark as New
- Bookmark
- Subscribe
- Mute
- Subscribe to RSS Feed
- Permalink
- Report Inappropriate Content
I think we are all on the same-page:
But to be clear: part of Vineeth's script that's needed to improve Dashboard performance, not the aggregation itself, agree?
Where RecNo() <=20
order by Sum_Amount DESC ;
- Mark as New
- Bookmark
- Subscribe
- Mute
- Subscribe to RSS Feed
- Permalink
- Report Inappropriate Content
Yes, it would do at script level (using one cpu core) what would be done at presentation level (maybe multi-core)
- Mark as New
- Bookmark
- Subscribe
- Mute
- Subscribe to RSS Feed
- Permalink
- Report Inappropriate Content
And according to rwunderlich at “Fastest” Method to Read max(field) From a QVD | Qlikview Cookbook
could be rewritten using FieldValue and FieldValueCount
TOP_SUMMARY:
LOAD
Owner,
Sum_Amount
Resident temp
Where RecNo() <=20
order by Sum_Amount DESC ;
- Mark as New
- Bookmark
- Subscribe
- Mute
- Subscribe to RSS Feed
- Permalink
- Report Inappropriate Content
So if I use Dimension Limit, but I don't use a sort;
In other words "just give me the first 10; in any order you calculate them"
1) Is this possible (i.e. "no sort/any sort /whatever sort")?
2) Will performance improve; (i.e. "since dimension limits doesn't care about order; don't calculate anything past the nth dimension!")?
- Mark as New
- Bookmark
- Subscribe
- Mute
- Subscribe to RSS Feed
- Permalink
- Report Inappropriate Content
I think it would perform better (not tested) but I don´t see how usefull that list would be
- Mark as New
- Bookmark
- Subscribe
- Mute
- Subscribe to RSS Feed
- Permalink
- Report Inappropriate Content
You mean picking 10 random owners out of a hat is not useful?
Yes, clearly I'm in "desperate" territory.
- Mark as New
- Bookmark
- Subscribe
- Mute
- Subscribe to RSS Feed
- Permalink
- Report Inappropriate Content
I think a regular user requirement would be
"List me the top 10 customers"
"List me the top 20 products"
I don´t remember any user asking me
"Bring me 10 customers no matter which position they are"
- Mark as New
- Bookmark
- Subscribe
- Mute
- Subscribe to RSS Feed
- Permalink
- Report Inappropriate Content
Dimension Limits is actually the slowest method of calculating Top N. My tests show Dimension Limits take 2.5x to 3.5x longer than using Presentation "Top Number" with a sort. Another alternative is Set Analysis which performs about 1.3x of "Top Number" solution.
sum({<Owner={"=rank(sum(Value))<11"}>}Value)
Attached is a QVW that demonstrates all three methods.
-Rob
- Mark as New
- Bookmark
- Subscribe
- Mute
- Subscribe to RSS Feed
- Permalink
- Report Inappropriate Content
Very cool. Very methodical, which I always appreciate from your performance-test QVW's.
But to be clear, all of these methods are still post-reload (i.e. they dont' affect data in QVW data-model), right?
That means it won't change cardinality of the field?
Furthermore, "Presentation tab > Max lines" is sometimes not available, even though Dimension limit is an option, right?
For example, a pie chart does not have "Presentation tab > Max lines", right?
However, even if I have the same cardinality as when I started (2M), I could still improve performance by that 2.5x-3.5x factor you mentioned, whenver I use a chart with the "Presentation tab > Max lines", right?
So it's a great tip and could be a complementary approach with a pre-load lower cardinality.
Am I missing anything?
- « Previous Replies
- Next Replies »