Unlock a world of possibilities! Login now and discover the exclusive benefits awaiting you.
- Qlik Community
- :
- All Forums
- :
- QlikView App Dev
- :
- Qlik View Charts Doudt
- Subscribe to RSS Feed
- Mark Topic as New
- Mark Topic as Read
- Float this Topic for Current User
- Bookmark
- Subscribe
- Mute
- Printer Friendly Page
- Mark as New
- Bookmark
- Subscribe
- Mute
- Subscribe to RSS Feed
- Permalink
- Report Inappropriate Content
Qlik View Charts Doudt
Hi
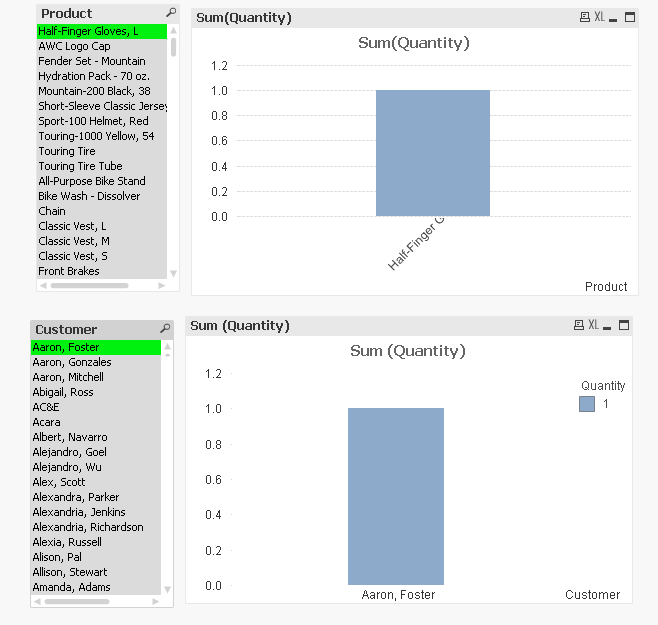
I have a requirement to display 2 List Boxes to display charts with respective of invidual selection list boxes.
when user select Product only the first chart will change. When user select Customer the respective chart required to change(single chart). But the below case when I select from any List Box both charts are changing. Please suggest.

Accepted Solutions
- Mark as New
- Bookmark
- Subscribe
- Mute
- Subscribe to RSS Feed
- Permalink
- Report Inappropriate Content
Let assume,
Fields are- Product, Customer and Quantity
For Product Chart
Expression: Sum({<Customer= >} Quantity)
For Customer Chart
Expression: Sum({<Product= >} Quantity)
- Mark as New
- Bookmark
- Subscribe
- Mute
- Subscribe to RSS Feed
- Permalink
- Report Inappropriate Content
Use Alternate States for those as you expected
- Mark as New
- Bookmark
- Subscribe
- Mute
- Subscribe to RSS Feed
- Permalink
- Report Inappropriate Content
Let assume,
Fields are- Product, Customer and Quantity
For Product Chart
Expression: Sum({<Customer= >} Quantity)
For Customer Chart
Expression: Sum({<Product= >} Quantity)
- Mark as New
- Bookmark
- Subscribe
- Mute
- Subscribe to RSS Feed
- Permalink
- Report Inappropriate Content
Thank You Its working for me