Unlock a world of possibilities! Login now and discover the exclusive benefits awaiting you.
- Qlik Community
- :
- All Forums
- :
- QlikView App Dev
- :
- Re: Qlikview bar chart hide and show
- Subscribe to RSS Feed
- Mark Topic as New
- Mark Topic as Read
- Float this Topic for Current User
- Bookmark
- Subscribe
- Mute
- Printer Friendly Page
- Mark as New
- Bookmark
- Subscribe
- Mute
- Subscribe to RSS Feed
- Permalink
- Report Inappropriate Content
Qlikview bar chart hide and show
Guys,
I have a grouped bar chart having dimension as "Mapping" as shown below,
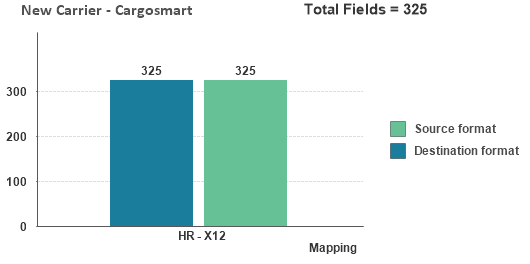
It is displayed when customer name is selected as "Cargosmart". For this single mapping in the chart, two bar charts will be displayed below as per my requirement.
Similarly, if I have a chart like below with two mappings, four bar charts to be displayed (should change dynamically according to the selections in the list box)
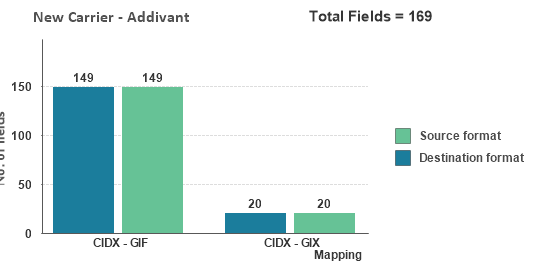
two bar charts for first mapping and another two bar charts for second mapping. Plz help me to achieve this, friends..
- Mark as New
- Bookmark
- Subscribe
- Mute
- Subscribe to RSS Feed
- Permalink
- Report Inappropriate Content
if you have the mapping for both customers name in same column it will display as you excepted rite ? what is the issue your facing ?
- Mark as New
- Bookmark
- Subscribe
- Mute
- Subscribe to RSS Feed
- Permalink
- Report Inappropriate Content
I need to show multiple bar charts dynamically based on the selected values in the list box (Customer name).
- Mark as New
- Bookmark
- Subscribe
- Mute
- Subscribe to RSS Feed
- Permalink
- Report Inappropriate Content
multiple bar charts? means for HR - X12 you have once bar chart and for CIDX - GIF and CIDX- GIX you have separate bar chart ?
then you you could give like getfeildselections([Customer name])='Customer Name'
share the sample app , so that we could understand better
- Mark as New
- Bookmark
- Subscribe
- Mute
- Subscribe to RSS Feed
- Permalink
- Report Inappropriate Content
Thanks Avinash, but plz let me know where to use the above mentioned expression?
- Mark as New
- Bookmark
- Subscribe
- Mute
- Subscribe to RSS Feed
- Permalink
- Report Inappropriate Content
Go to chart Properties >Layout>Show> Conditional > add the condition
Hope this helps you