Unlock a world of possibilities! Login now and discover the exclusive benefits awaiting you.
- Qlik Community
- :
- All Forums
- :
- QlikView App Dev
- :
- Re: Qlikview model keeps crashing
- Subscribe to RSS Feed
- Mark Topic as New
- Mark Topic as Read
- Float this Topic for Current User
- Bookmark
- Subscribe
- Mute
- Printer Friendly Page
- Mark as New
- Bookmark
- Subscribe
- Mute
- Subscribe to RSS Feed
- Permalink
- Report Inappropriate Content
Qlikview model keeps crashing
Hi all
I have a Qlikview model which I have created. it is 500MB big. The model consists of 3 tables. Table one = 500k rows (13 variables)
Table two = 82 million rows (14 variables), Table 3 = 10 million rows (5 variables ).
All of the tables are QVD's stored on the client computer.
The tables take 40 seconds to load. The model has 2 tabs. The first tab has 5 graphs with 4 filters available.
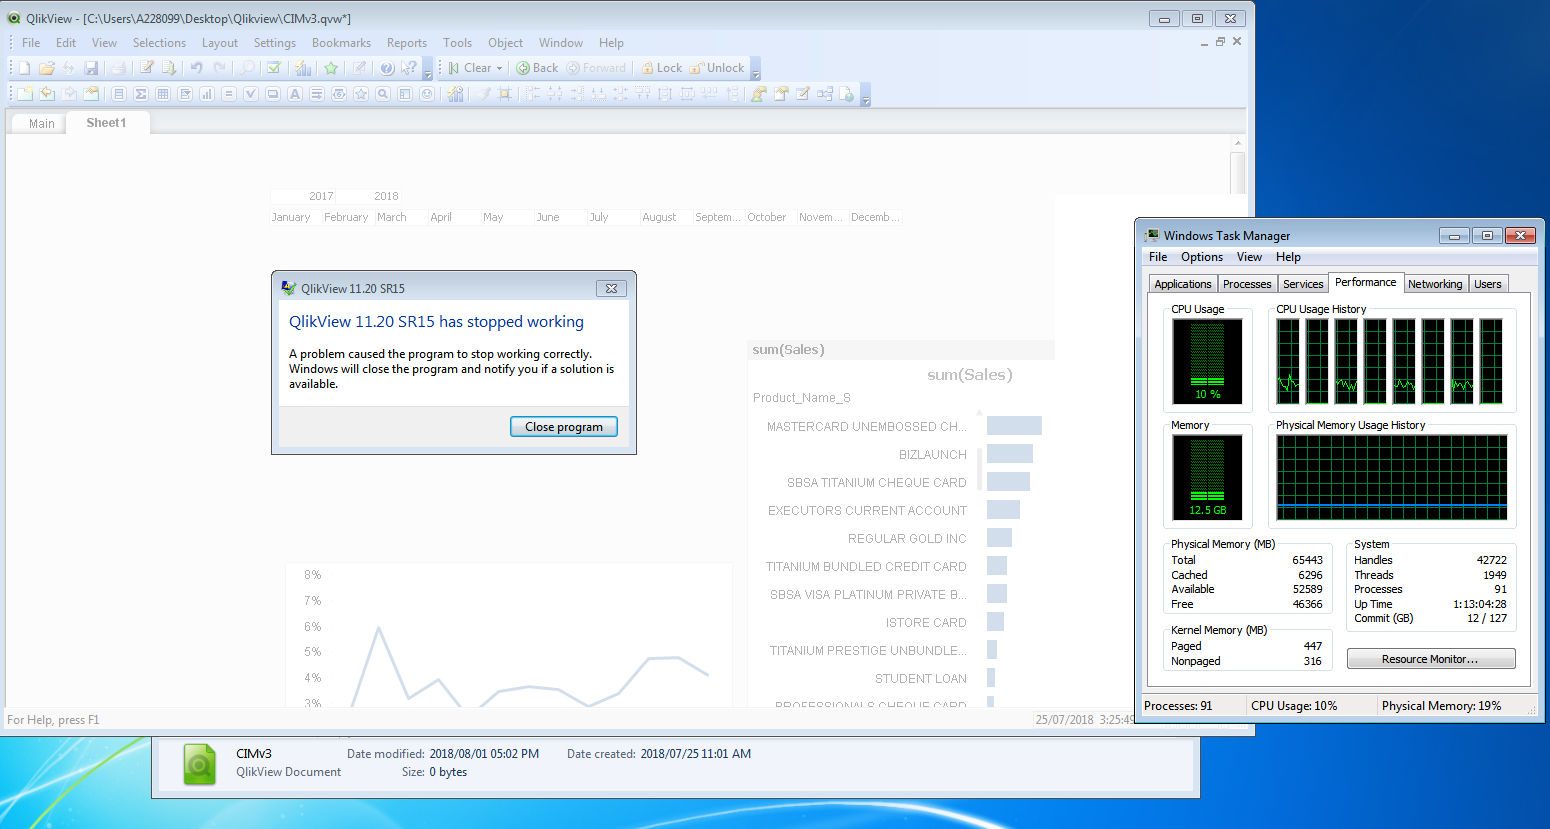
Now when I try to create table graphs on the second tab Qlikview crashed all the time.
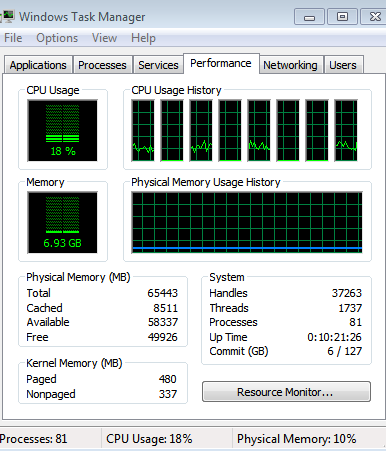
I have more than enough RAM (64GB) with Qlikview opened there's on average there's only 6GB in use and 10% CPU usage.
The model has no synthetic keys.
I am Qlikview 12 and I'm opening the file in server.
What would I need to check or change to prevent Qlikview from crashing every time I try working on this report?
- « Previous Replies
-
- 1
- 2
- Next Replies »
- Mark as New
- Bookmark
- Subscribe
- Mute
- Subscribe to RSS Feed
- Permalink
- Report Inappropriate Content
Might be due to the gigantic amount of data your trying to get from table two (82 million rows) with all the columns your trying to put in the table.
Can also be a bad relationship between the fields you put on the table, since it might be that they aren't connected and if you put fields that aren't related in the data model Qlik will make a "join" on the visualization side, expanding the data even further.
- Mark as New
- Bookmark
- Subscribe
- Mute
- Subscribe to RSS Feed
- Permalink
- Report Inappropriate Content
Is it failing when you create a table or during navigation to different sheet tab?
- Mark as New
- Bookmark
- Subscribe
- Mute
- Subscribe to RSS Feed
- Permalink
- Report Inappropriate Content
The tables are linked on a common variable. One is a sales table, one is a leads table , and the is a customers table which holds customer information. They all have a Party_ID that identifies the customer and that is used to link the tables. The party_ID is the most granular level of detail on all the tables.

- Mark as New
- Bookmark
- Subscribe
- Mute
- Subscribe to RSS Feed
- Permalink
- Report Inappropriate Content
The report has 2 tabs so far the first tab has 4 graphs when I try adding a graph on the second tab that's when Qlikview fails. Navigating between the tabs in not a problem.
- Mark as New
- Bookmark
- Subscribe
- Mute
- Subscribe to RSS Feed
- Permalink
- Report Inappropriate Content
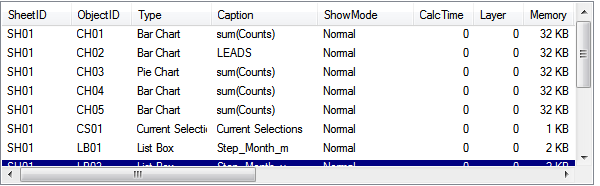
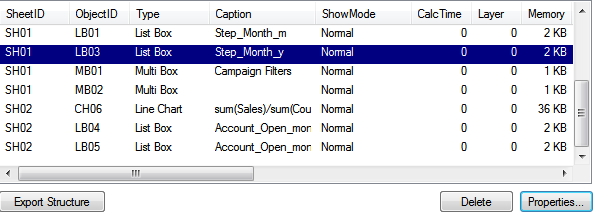
In your current app before adding any additional chart objects can you check the memory and calc time of those added objects from Document properties. Like Click Ctrl+Alt+D to open doc properties and go to sheets tab and look in the bottom table for Calc time and Memory and other columns send us a screen shot if possible?
- Mark as New
- Bookmark
- Subscribe
- Mute
- Subscribe to RSS Feed
- Permalink
- Report Inappropriate Content
Hi Vishwarath, i have please see attached the screen shots Calc Time and Memory
- Mark as New
- Bookmark
- Subscribe
- Mute
- Subscribe to RSS Feed
- Permalink
- Report Inappropriate Content
What are the Dimensions you are using in your 2nd tab, Table graphs?
May be the Granularity between different tables causing the issue.
- Mark as New
- Bookmark
- Subscribe
- Mute
- Subscribe to RSS Feed
- Permalink
- Report Inappropriate Content
The second graph (bar graph) which im trying to add is meant to show data from the same table. The expression sums up a variable and shows it along a dimension variable that is on the same table. This table has 500K rows.
- Mark as New
- Bookmark
- Subscribe
- Mute
- Subscribe to RSS Feed
- Permalink
- Report Inappropriate Content
Can you share your variable expression you are using? Also can you upload your file if possible?
- « Previous Replies
-
- 1
- 2
- Next Replies »