Unlock a world of possibilities! Login now and discover the exclusive benefits awaiting you.
- Qlik Community
- :
- All Forums
- :
- QlikView App Dev
- :
- Range of dates / years
- Subscribe to RSS Feed
- Mark Topic as New
- Mark Topic as Read
- Float this Topic for Current User
- Bookmark
- Subscribe
- Mute
- Printer Friendly Page
- Mark as New
- Bookmark
- Subscribe
- Mute
- Subscribe to RSS Feed
- Permalink
- Report Inappropriate Content
Range of dates / years
Hi all,
I have a chart and it shows years from 2005 to 2020, how do I narrow this down to show only 2015 or 2015-2020
I have tried =year(competition. start date) = '2015' and it does not work. Appreciate any help.
Thank you
- Tags:
- new_to_qlikview
- « Previous Replies
-
- 1
- 2
- Next Replies »
Accepted Solutions
- Mark as New
- Bookmark
- Subscribe
- Mute
- Subscribe to RSS Feed
- Permalink
- Report Inappropriate Content
If you just want to see the year, try this:
=If(Year([Opportunity.Anticipated Close Date]) >= 2015, Year([Opportunity.Anticipated Close Date]))
- Mark as New
- Bookmark
- Subscribe
- Mute
- Subscribe to RSS Feed
- Permalink
- Report Inappropriate Content
You can do this two ways:
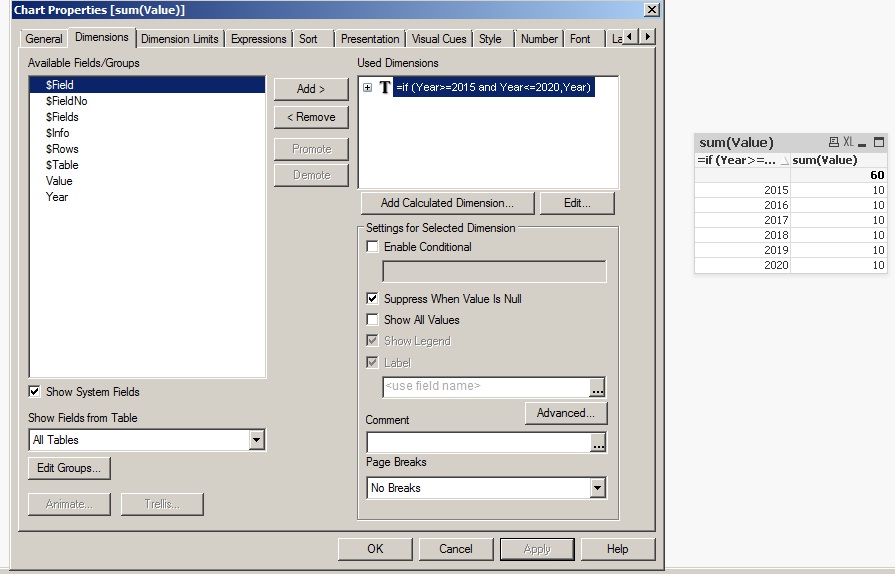
1) change your dimension Year to a calculated dimension and select 'Suppress when Value Is Null' option on Dimension properties tab
If(Year = 2015, Year) for 2015 only
If(Year >=2015, Year) for 2015-2020
2) Using Set analysis in your expressions:
{<Year = {'2015'}>} for 2015 only
{<Year = {'>=2015'}>} for 2015-2020
HTH
Best,
Sunny
- Mark as New
- Bookmark
- Subscribe
- Mute
- Subscribe to RSS Feed
- Permalink
- Report Inappropriate Content

- Mark as New
- Bookmark
- Subscribe
- Mute
- Subscribe to RSS Feed
- Permalink
- Report Inappropriate Content
Hi Sunny,
Thanks for the idea. The field which I am using is a date filed and I have included your expression but I still cannot get it to work. Any ideas?

- Mark as New
- Bookmark
- Subscribe
- Mute
- Subscribe to RSS Feed
- Permalink
- Report Inappropriate Content
It should be
if(Year([Your Date Field])>=2015, [Your Date Field])
- Mark as New
- Bookmark
- Subscribe
- Mute
- Subscribe to RSS Feed
- Permalink
- Report Inappropriate Content
Thank you but see result below. How do I get this to show just the year or the month?

- Mark as New
- Bookmark
- Subscribe
- Mute
- Subscribe to RSS Feed
- Permalink
- Report Inappropriate Content
If you just want to see the year, try this:
=If(Year([Opportunity.Anticipated Close Date]) >= 2015, Year([Opportunity.Anticipated Close Date]))
- Mark as New
- Bookmark
- Subscribe
- Mute
- Subscribe to RSS Feed
- Permalink
- Report Inappropriate Content
Hi,
=if(year(DATE_Field)='2015',(year(DATE_field)) for 2015
=if(year(DATE_Field)>='2015',(year(DATE_field)) for for 2015-2020
Hope it helps you.
Regards,
Kavita
- Mark as New
- Bookmark
- Subscribe
- Mute
- Subscribe to RSS Feed
- Permalink
- Report Inappropriate Content
Hi,
Arrive a year field from that Date in script and use this in frontend, it is not a good practice to use calculated dimension in charts. It may cause performance issues.
LOAD
*,
Year(DateFieldName) AS Year
FROM DataSource;
Now in front end
Dimension: Year
Expression: Sum({<DateFieldName=, Year={'>=$(=Year(Today()))'}>} MeasureName)
Replace DateFieldName and MeasureName with your actual field names.
Regards,
Jagan.
- Mark as New
- Bookmark
- Subscribe
- Mute
- Subscribe to RSS Feed
- Permalink
- Report Inappropriate Content
Try this for Year:
=If(Year([Opportunity.Anticipated Close Date]) >= 2015, Year([Opportunity.Anticipated Close Date]))
And for Month you can try this:
=If(Year([Opportunity.Anticipated Close Date]) >= 2015, MonthName([Opportunity.Anticipated Close Date]))
- « Previous Replies
-
- 1
- 2
- Next Replies »