Unlock a world of possibilities! Login now and discover the exclusive benefits awaiting you.
- Qlik Community
- :
- All Forums
- :
- QlikView App Dev
- :
- Rank top 10%, 20%, 30% .... customers as 1,2,3...e...
- Subscribe to RSS Feed
- Mark Topic as New
- Mark Topic as Read
- Float this Topic for Current User
- Bookmark
- Subscribe
- Mute
- Printer Friendly Page
- Mark as New
- Bookmark
- Subscribe
- Mute
- Subscribe to RSS Feed
- Permalink
- Report Inappropriate Content
Rank top 10%, 20%, 30% .... customers as 1,2,3...etc..
Hello!!
I have a table chart with customerName, CustomerID as dimension and sum(OrderValues) as expression. I want to add another expression in the same chart, where I want to find top 10%, 20%, 30%, 40%.....100% and Rank/Mark them as
Top 10% Rank = 1
between 10.01% - 20 % Rank = 2
between 20.01% - 30 % Rank = 3
between 30.01% - 40 % Rank = 4
.........etc until 100%
How Do I do this? Thanks for your help.
- Mark as New
- Bookmark
- Subscribe
- Mute
- Subscribe to RSS Feed
- Permalink
- Report Inappropriate Content
Please post sample data here so community will help accurately.
- Mark as New
- Bookmark
- Subscribe
- Mute
- Subscribe to RSS Feed
- Permalink
- Report Inappropriate Content
Please find the sample data. There are millions and millions of rows in real scenario. Thanks for your help.
- Mark as New
- Bookmark
- Subscribe
- Mute
- Subscribe to RSS Feed
- Permalink
- Report Inappropriate Content
Find the attachment.This may solve your issue.
Sivaraj
- Mark as New
- Bookmark
- Subscribe
- Mute
- Subscribe to RSS Feed
- Permalink
- Report Inappropriate Content
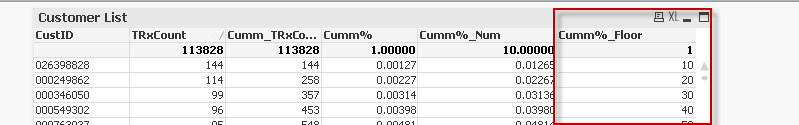
I have attached a sample QVW that will do almost the same thing. However, Floor function Doesn't work for some bizzare reason. Expression that uses floor and is not working is "Cumm%_Floor". What am I missing?
- Mark as New
- Bookmark
- Subscribe
- Mute
- Subscribe to RSS Feed
- Permalink
- Report Inappropriate Content
Thanks for you Help Siva but as you can see there is equal distribution of Customers per rank in your solution. Most of the counts of customers stay around 3000 for all ranks. That cannot be true. Top 10 % customers should be a lot lower than 3000. In my opinion its almost around few 100s. And between top 10 and Top 20% are little higher than top 10 but still not be 3000. MAjority of the customers will fall in lower ranks. Thanks once again for your help.
