Unlock a world of possibilities! Login now and discover the exclusive benefits awaiting you.
- Qlik Community
- :
- All Forums
- :
- QlikView App Dev
- :
- Regression line where dimension is not value
- Subscribe to RSS Feed
- Mark Topic as New
- Mark Topic as Read
- Float this Topic for Current User
- Bookmark
- Subscribe
- Mute
- Printer Friendly Page
- Mark as New
- Bookmark
- Subscribe
- Mute
- Subscribe to RSS Feed
- Permalink
- Report Inappropriate Content
Regression line where dimension is not value
Hi,
Distance:
LOAD * INLINE [
Country, StopPoints
Country1, City1
Country1, City2
Country1, City3
Country2, City1
Country2, City2
Country3, City1
Country3, City2
Country3, City3
Country3, City4
];
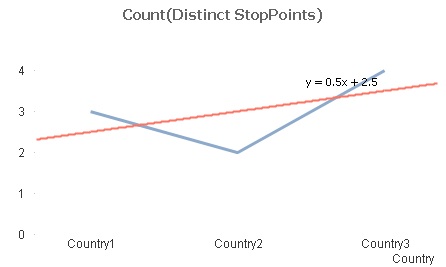
I need Regression line as separate field in a line chart.
What should I change here?
=LINEST_M(TOTAL Aggr(Count(Distinct StopPoints), Country), Country)*Country + LINEST_B(TOTAL Aggr(Count(Distinct StopPoints), Country), Country)
Thx.
Accepted Solutions
- Mark as New
- Bookmark
- Subscribe
- Mute
- Subscribe to RSS Feed
- Permalink
- Report Inappropriate Content
If you want to use the linest functions, you need to use numerical data for the x and y pairs.
As far as I understood, you can create a table with Country replaced by its priority as x value and the distinct count of StopPoints as y value.
- Mark as New
- Bookmark
- Subscribe
- Mute
- Subscribe to RSS Feed
- Permalink
- Report Inappropriate Content
Not sure how you want to do this (i.e. calculating slope and intersection of a linear regression line) using non-numerical data.
Do you want to create artificial numeric values based on the text values? Given what logic (I assume your text values are named differently in real life, not ...1, ....2 etc.)?
Could you elaborate?
- Mark as New
- Bookmark
- Subscribe
- Mute
- Subscribe to RSS Feed
- Permalink
- Report Inappropriate Content
Or maybe and even better in terms of 'finding a way to help', describe the use case behind that, what do you want to achieve finally?
- Mark as New
- Bookmark
- Subscribe
- Mute
- Subscribe to RSS Feed
- Permalink
- Report Inappropriate Content
In real life it is also ...1,...2,...3
They are Period1, Period2, Period3
They don't have any date field. Only priority by names.
According to this periods I have to create regression line.
As far as I see QV can do this

- Mark as New
- Bookmark
- Subscribe
- Mute
- Subscribe to RSS Feed
- Permalink
- Report Inappropriate Content
If you want to use the linest functions, you need to use numerical data for the x and y pairs.
As far as I understood, you can create a table with Country replaced by its priority as x value and the distinct count of StopPoints as y value.
- Mark as New
- Bookmark
- Subscribe
- Mute
- Subscribe to RSS Feed
- Permalink
- Report Inappropriate Content
Do you know how to make manual 'Full Accumulation' in Regression line?
Thx.
- Mark as New
- Bookmark
- Subscribe
- Mute
- Subscribe to RSS Feed
- Permalink
- Report Inappropriate Content
There is nothing like a chart option to do this with the linest functions, so you need to create accumulated values yourself.
For example:
Calculating rolling n-period totals, averages or other aggregations