Unlock a world of possibilities! Login now and discover the exclusive benefits awaiting you.
- Qlik Community
- :
- All Forums
- :
- QlikView App Dev
- :
- Remove a part the legend in a bar chart
- Subscribe to RSS Feed
- Mark Topic as New
- Mark Topic as Read
- Float this Topic for Current User
- Bookmark
- Subscribe
- Mute
- Printer Friendly Page
- Mark as New
- Bookmark
- Subscribe
- Mute
- Subscribe to RSS Feed
- Permalink
- Report Inappropriate Content
Remove a part the legend in a bar chart
Hello,everyone!
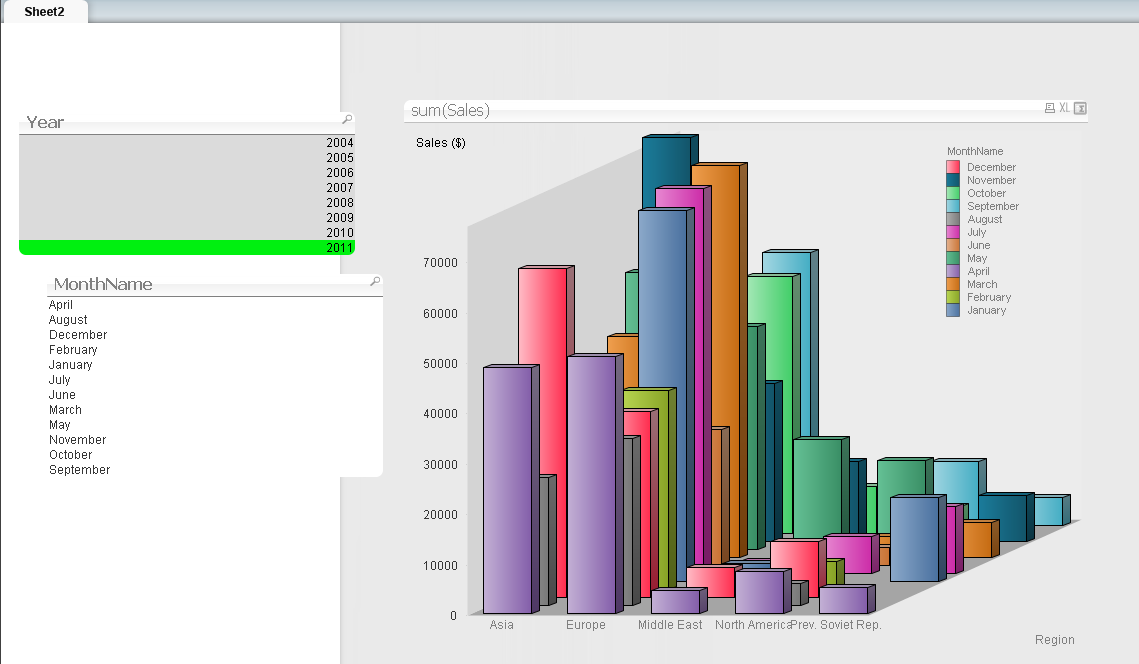
Can you, please, help me make the marked part of the legend invisible? (screenshot enclosed) If i make the text of axis white, months disappear as well, and I need them to stay, as well as the main legend where the colour-scheme is mentioned.
Thenk you in advance
Accepted Solutions
- Mark as New
- Bookmark
- Subscribe
- Mute
- Subscribe to RSS Feed
- Permalink
- Report Inappropriate Content
Have a look at the attached. I added a 3rd dimension that is the same as the 2nd dimension. 2nd dimension has 'legend' disabled and 3rd dimension has it enabled. Effect below.


- Mark as New
- Bookmark
- Subscribe
- Mute
- Subscribe to RSS Feed
- Permalink
- Report Inappropriate Content
Have a look at the attached. I added a 3rd dimension that is the same as the 2nd dimension. 2nd dimension has 'legend' disabled and 3rd dimension has it enabled. Effect below.


- Mark as New
- Bookmark
- Subscribe
- Mute
- Subscribe to RSS Feed
- Permalink
- Report Inappropriate Content
it works! Thank you very much!!!![]()
- Mark as New
- Bookmark
- Subscribe
- Mute
- Subscribe to RSS Feed
- Permalink
- Report Inappropriate Content
That is one ugly and unreadable graph, both "2d" or "3d" ![]()
- Mark as New
- Bookmark
- Subscribe
- Mute
- Subscribe to RSS Feed
- Permalink
- Report Inappropriate Content
If only trellis charts looked half-decent. ![]()
- Mark as New
- Bookmark
- Subscribe
- Mute
- Subscribe to RSS Feed
- Permalink
- Report Inappropriate Content
which one do you prefer?=)
- Mark as New
- Bookmark
- Subscribe
- Mute
- Subscribe to RSS Feed
- Permalink
- Report Inappropriate Content
If I had to put 2 dimensions onto the same chart then I would prefer a line chart or a grid chart. Purists dont like line charts because you are supposed to be able infer intermediate values, but when you are looking at multi-streams they work well. Grid charts are cool and work very well, but are not part of the 'standard' set of charts people know so you will find people are less comfortable with them.
- Mark as New
- Bookmark
- Subscribe
- Mute
- Subscribe to RSS Feed
- Permalink
- Report Inappropriate Content
There's an interesting look at Grid / Heat charts here:
qlikboard.com / tag / gridchart
Remove the spaces to get a valid URL!