Unlock a world of possibilities! Login now and discover the exclusive benefits awaiting you.
- Qlik Community
- :
- All Forums
- :
- QlikView App Dev
- :
- Re: Repetition of results in Pivot table
- Subscribe to RSS Feed
- Mark Topic as New
- Mark Topic as Read
- Float this Topic for Current User
- Bookmark
- Subscribe
- Mute
- Printer Friendly Page
- Mark as New
- Bookmark
- Subscribe
- Mute
- Subscribe to RSS Feed
- Permalink
- Report Inappropriate Content
Repetition of results in Pivot table
Dear All
I have a small question which drives me crazy: I have a pivot and get the following results:
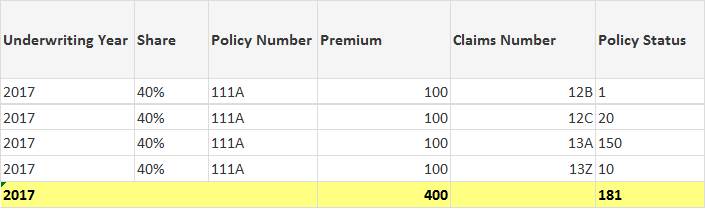
However, the premium should only be 100, however, as the claims are matched to the policy, if I add the claims number as a dimension the premium numbers multiply times the number of claims.
Is it possible to get a pivot table that does not multiply the premium and might look like that:
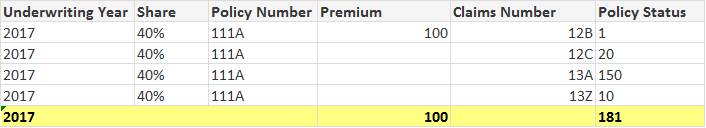
Many thanks.
Best regards,
Jan
Accepted Solutions
- Mark as New
- Bookmark
- Subscribe
- Mute
- Subscribe to RSS Feed
- Permalink
- Report Inappropriate Content
An alternatively might be to divide the sum through the count which would result in 25 of row-level and 100 in total. Another way might be to apply the sum only by rowno()=1.
- Marcus
- Mark as New
- Bookmark
- Subscribe
- Mute
- Subscribe to RSS Feed
- Permalink
- Report Inappropriate Content
Couldn't you just take the average like: avg(Premium) or maybe avg(aggr(sum(Premium), [Policy Number])) ?
- Marcus
- Mark as New
- Bookmark
- Subscribe
- Mute
- Subscribe to RSS Feed
- Permalink
- Report Inappropriate Content
That would work for me but our customers would be confused.
- Mark as New
- Bookmark
- Subscribe
- Mute
- Subscribe to RSS Feed
- Permalink
- Report Inappropriate Content
would it be helpful for the end users if you display the Claim info as a concatenated string separated by a '|' or other separator. In that way it will be only one row at policy level and claims related to that policy being displayed together concatenated.
- Mark as New
- Bookmark
- Subscribe
- Mute
- Subscribe to RSS Feed
- Permalink
- Report Inappropriate Content
Unfortunately I need to match a certain format manually done today in excel. I would need the table to look exactly as above.
- Mark as New
- Bookmark
- Subscribe
- Mute
- Subscribe to RSS Feed
- Permalink
- Report Inappropriate Content
An alternatively might be to divide the sum through the count which would result in 25 of row-level and 100 in total. Another way might be to apply the sum only by rowno()=1.
- Marcus
- Mark as New
- Bookmark
- Subscribe
- Mute
- Subscribe to RSS Feed
- Permalink
- Report Inappropriate Content
The rowno()=1 did the trick.
Many thanks.
Jan