Unlock a world of possibilities! Login now and discover the exclusive benefits awaiting you.
- Qlik Community
- :
- All Forums
- :
- QlikView App Dev
- :
- Representation of dimensions
- Subscribe to RSS Feed
- Mark Topic as New
- Mark Topic as Read
- Float this Topic for Current User
- Bookmark
- Subscribe
- Mute
- Printer Friendly Page
- Mark as New
- Bookmark
- Subscribe
- Mute
- Subscribe to RSS Feed
- Permalink
- Report Inappropriate Content
Representation of dimensions
Hi!
I have the following chart in my qlik:
| Manager | 5GALL | PET | BOU |
| Manger 1 | 760.56 | 65.52 | 470.60 |
| Manger 2 | 589.93 | 50.67 | 334.20 |
| Manger 3 | 314.74 | 32.93 | 213.00 |
| Manger 4 | 236.19 | 17.84 | 150.03 |
Where, Manager, 5GALL, PET and BOU are dimensions.
I need for integration with other systems made anothor represenatation of this chart:
| Header 1 | Header 2 | Header 3 |
|---|---|---|
| Manger 1 | 760.56 | 5GALL |
| Manger 1 | 65.52 | PET |
| Manger 1 | 470.60 | BOU |
| Manger 2 | 589.93 | 5GALL |
| Manger 2 | 50.67 | PET |
| Manger 2 | 334.20 | BOU |
| Manger 3 | 314.74 | 5GALL |
| Manger 3 | 32.93 | PET |
| Manger 3 | 213.00 | BOU |
| Manger 4 | 236.19 | 5GALL |
| Manger 4 | 17.84 | PET |
| Manger 4 | 150.03 | BOU |
..or somthing similar..
How can I do it?
Thank you in advance for you attention and help!
Accepted Solutions
- Mark as New
- Bookmark
- Subscribe
- Mute
- Subscribe to RSS Feed
- Permalink
- Report Inappropriate Content
the best would be cross table :
CrossTable([5GALL1], Data)
LOAD Manager,
[5GALL],
PET,
BOU
FROM
(ooxml, embedded labels, table is Sheet1);
see attached qvw.
- Mark as New
- Bookmark
- Subscribe
- Mute
- Subscribe to RSS Feed
- Permalink
- Report Inappropriate Content
Try to post qvw and expected O/P
- Mark as New
- Bookmark
- Subscribe
- Mute
- Subscribe to RSS Feed
- Permalink
- Report Inappropriate Content
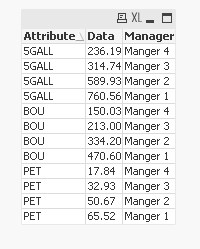
CrossTable(Attribute, Data)
LOAD Manager,
     [5GALL],
     PET,
     BOU
FROM

(ooxml, embedded labels, table is Sheet1);
Result:
- Mark as New
- Bookmark
- Subscribe
- Mute
- Subscribe to RSS Feed
- Permalink
- Report Inappropriate Content
Looks you need a CrossTable Load.
Henric explains this function well in his Blog Post, The Crosstable Load
- Mark as New
- Bookmark
- Subscribe
- Mute
- Subscribe to RSS Feed
- Permalink
- Report Inappropriate Content
Look like a solution I need,
can you please upload the qlik file, you have created?
- Mark as New
- Bookmark
- Subscribe
- Mute
- Subscribe to RSS Feed
- Permalink
- Report Inappropriate Content
create a pivot table in Qlikview using manager as dimension and sum(5GALL) and sum(PET) and sum(BOU) as expressions.
- Mark as New
- Bookmark
- Subscribe
- Mute
- Subscribe to RSS Feed
- Permalink
- Report Inappropriate Content
the best would be cross table :
CrossTable([5GALL1], Data)
LOAD Manager,
[5GALL],
PET,
BOU
FROM
(ooxml, embedded labels, table is Sheet1);
see attached qvw.
- Mark as New
- Bookmark
- Subscribe
- Mute
- Subscribe to RSS Feed
- Permalink
- Report Inappropriate Content
Thank you ... this works too!