Unlock a world of possibilities! Login now and discover the exclusive benefits awaiting you.
- Qlik Community
- :
- All Forums
- :
- QlikView App Dev
- :
- Re: Return Dimension with Highest Percentage
- Subscribe to RSS Feed
- Mark Topic as New
- Mark Topic as Read
- Float this Topic for Current User
- Bookmark
- Subscribe
- Mute
- Printer Friendly Page
- Mark as New
- Bookmark
- Subscribe
- Mute
- Subscribe to RSS Feed
- Permalink
- Report Inappropriate Content
Return Dimension with Highest Percentage
Hi All,
I need help with some code. This is for Qlik Sense.
Business Question:
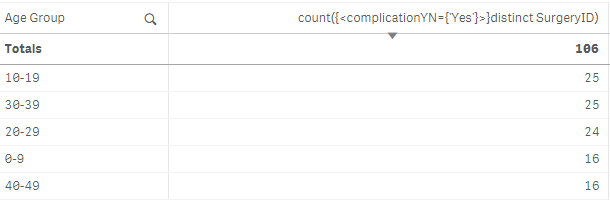
Which age group has the highest percentage of surgery complications?
- Age Group
- SurgeryID
- complicationYN = {'Yes'}
Percentage of surgeries with complications ... this works
= Count({<complicationYN = {'Yes'}>} SurgeryID)/Count(SurgeryID)
Age group with the highest count of surgeries ..... this works
= FirstSortedValue([Age Group], -Aggr(Count(distinct SurgeryID), [Age Group]))
Age group with the highest count of surgeries with complications ..... these do NOT work ... return a '-'
= FirstSortedValue([Age Group], -Aggr(If(complicationYN = 'Yes', Count(distinct SurgeryID)), [Age Group]))
= FirstSortedValue([Age Group], -Aggr(Count({<complicationYN = {'Yes'}>} distinct SurgeryID), [Age Group]))
= If(complicationYN = 'Yes', FirstSortedValue([Age Group], -Aggr(Count(distinct SurgeryID), [Age Group])))
Age group with the highest percentage of surgeries with complications .....
= ? ? ? ? ? ? ? ? ?
| Age Groups | # Surgeries | # Complications | % of Surgeries w/ Complications |
| 0-9 | 189 | 16 | 8.5% |
| 10-19 | 201 | 25 | 12.4% |
| 20-29 | 320 | 24 | 7.5% |
| 30-39 | 315 | 25 | 7.9% |
| 40-49 | 154 | 16 | 10.4% |
| 50-59 | 14 | 0 | 0.0% |
| 60-69 | 1 | 0 | 0.0% |
| [Age Group] | |||
| # Surgeries = Count(SurgeryID) | |||
| # Complications = Count({<complicationYN = {'Yes'}>} SurgeryID) | |||
| % of Surgeries w/ Complications = Count({<complicationYN = {'Yes'}>} SurgeryID) / Count(SurgeryID) | |||
| Age Group w/Highest % of Complications = ? ? ? ? ? | |||
Thanks in advance,
Mindy
- « Previous Replies
-
- 1
- 2
- Next Replies »
- Mark as New
- Bookmark
- Subscribe
- Mute
- Subscribe to RSS Feed
- Permalink
- Report Inappropriate Content
Hi
second expression seems good,
but if you've got null it's surely because you have tie (you can check it with your data
(firstsortedvalue returns null with tie)
try :
FirstSortedValue([Age Group], -Aggr(Count({<complicationYN = {'Yes'}>} distinct SurgeryID) & [Age Group], [Age Group]))
you'll have one of the ties
if you want all ties, use rank()
regards
- Mark as New
- Bookmark
- Subscribe
- Mute
- Subscribe to RSS Feed
- Permalink
- Report Inappropriate Content
to display ties
you could try :
= concat( if(aggr(num(rank(-count({<complicationYN = {'Yes'}>} distinct SurgeryID))),[Age Group])=1,[Age Group]),'*')
- Mark as New
- Bookmark
- Subscribe
- Mute
- Subscribe to RSS Feed
- Permalink
- Report Inappropriate Content
This didn't work. Returned ... 0-9*40-49
- Mark as New
- Bookmark
- Subscribe
- Mute
- Subscribe to RSS Feed
- Permalink
- Report Inappropriate Content
This didn't work. Returned a '-'.
- Mark as New
- Bookmark
- Subscribe
- Mute
- Subscribe to RSS Feed
- Permalink
- Report Inappropriate Content
could you share some rows in xlsx to verify expression please ?
- Mark as New
- Bookmark
- Subscribe
- Mute
- Subscribe to RSS Feed
- Permalink
- Report Inappropriate Content
I've attached the data. Appreciate all this help.
Thanks,
Mindy
- Mark as New
- Bookmark
- Subscribe
- Mute
- Subscribe to RSS Feed
- Permalink
- Report Inappropriate Content
Hi,
maybe you can do it in another simpler way:
1) rank(Count({<complicationYN={'YES'}>} SurgeryID)/Count(SurgeryID))
in this way you rank values
2) go to the chart property and hide the column with the expression
3) set max number of records =1
see attached file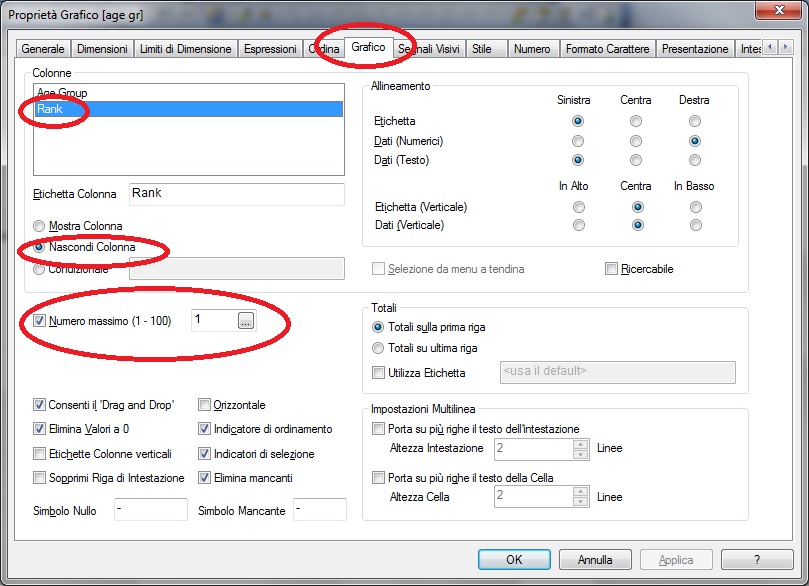
- Mark as New
- Bookmark
- Subscribe
- Mute
- Subscribe to RSS Feed
- Permalink
- Report Inappropriate Content
Hi Matteo,
Thanks for responding but I forgot to mention that this is for Qlik Sense. So, your solution won't work.
Mindy
- Mark as New
- Bookmark
- Subscribe
- Mute
- Subscribe to RSS Feed
- Permalink
- Report Inappropriate Content
It results two [Age Group] either at the lowest or highest, hence FirstSortedValue returns "-"
- « Previous Replies
-
- 1
- 2
- Next Replies »