Unlock a world of possibilities! Login now and discover the exclusive benefits awaiting you.
- Qlik Community
- :
- All Forums
- :
- QlikView App Dev
- :
- Rolling Percentage Calculation
- Subscribe to RSS Feed
- Mark Topic as New
- Mark Topic as Read
- Float this Topic for Current User
- Bookmark
- Subscribe
- Mute
- Printer Friendly Page
- Mark as New
- Bookmark
- Subscribe
- Mute
- Subscribe to RSS Feed
- Permalink
- Report Inappropriate Content
Rolling Percentage Calculation
Hello,
I am trying to calculate a projected traffic number using the percentage listed on the table. For example, ABC.com's actual traffic starting from Dec-2017 is 300 and we expect a 25% increase in Jan-2018. Therefore, ABC.com's projected traffic would be 375. Then we take 375 and apply the 10% increase for Feb-2018 projected traffic number, and repeating this step for subsequent months. Is this possible to replicate in the script in Qlikview?
This table example is the desired output in Qlikview.
| domain | month_year | percentage | actual traffic | projected traffic |
|---|---|---|---|---|
| ABC.com | Dec-2017 | - | 300 | - |
| ABC.com | Jan-2018 | 0.25 | - | (300 * (1 + .25)) = 375 |
| ABC.com | Feb-2018 | 0.1 | - | (375 * (1 + 1.1)) = 412.5 |
| ABC.com | Mar-2018 | -0.05 | - | (412.5 * (1 - 0.05)) = 391.9 |
| ABC.com | Apr-2018 | 0.3 | - | (391.9 * (1 + 0.3)) = 509.4 |
Thank you!
Accepted Solutions
- Mark as New
- Bookmark
- Subscribe
- Mute
- Subscribe to RSS Feed
- Permalink
- Report Inappropriate Content
traffic:
LOAD domain,
     date(num#(month_year),'MMM-YYYY') as month_year,
     percentage
FROM
[Traffic Numbers.xlsx]
(ooxml, embedded labels, table is Sheet1);


join
LOAD domain,
     date(num#(month_year),'MMM-YYYY') as month_year,
     [actual traffic]
FROM
[Traffic Numbers.xlsx]
(ooxml, embedded labels, table is Sheet2);


Final:
Load
 domain,
 month_year,
 percentage,
 [actual traffic],
 Num(If(domain <> Previous(domain),[actual traffic], Peek('projectedtraffic')*(1+percentage)),'#,##0.0') as [projectedtraffic]
Resident traffic
Order by domain, month_year;


Drop Table traffic;
- Mark as New
- Bookmark
- Subscribe
- Mute
- Subscribe to RSS Feed
- Permalink
- Report Inappropriate Content
We can do this in script... but you need to provide sample data for that so that we can modify the script and reload the app.
- Mark as New
- Bookmark
- Subscribe
- Mute
- Subscribe to RSS Feed
- Permalink
- Report Inappropriate Content
Oh sorry about that, I have attached the excel file in the post. Thanks!
- Mark as New
- Bookmark
- Subscribe
- Mute
- Subscribe to RSS Feed
- Permalink
- Report Inappropriate Content
traffic:
LOAD domain,
     date(num#(month_year),'MMM-YYYY') as month_year,
     percentage
FROM
[Traffic Numbers.xlsx]
(ooxml, embedded labels, table is Sheet1);


join
LOAD domain,
     date(num#(month_year),'MMM-YYYY') as month_year,
     [actual traffic]
FROM
[Traffic Numbers.xlsx]
(ooxml, embedded labels, table is Sheet2);


Final:
Load
 domain,
 month_year,
 percentage,
 [actual traffic],
 Num(If(domain <> Previous(domain),[actual traffic], Peek('projectedtraffic')*(1+percentage)),'#,##0.0') as [projectedtraffic]
Resident traffic
Order by domain, month_year;


Drop Table traffic;
- Mark as New
- Bookmark
- Subscribe
- Mute
- Subscribe to RSS Feed
- Permalink
- Report Inappropriate Content
Thank you very much Manish! It worked just fine.
- Mark as New
- Bookmark
- Subscribe
- Mute
- Subscribe to RSS Feed
- Permalink
- Report Inappropriate Content
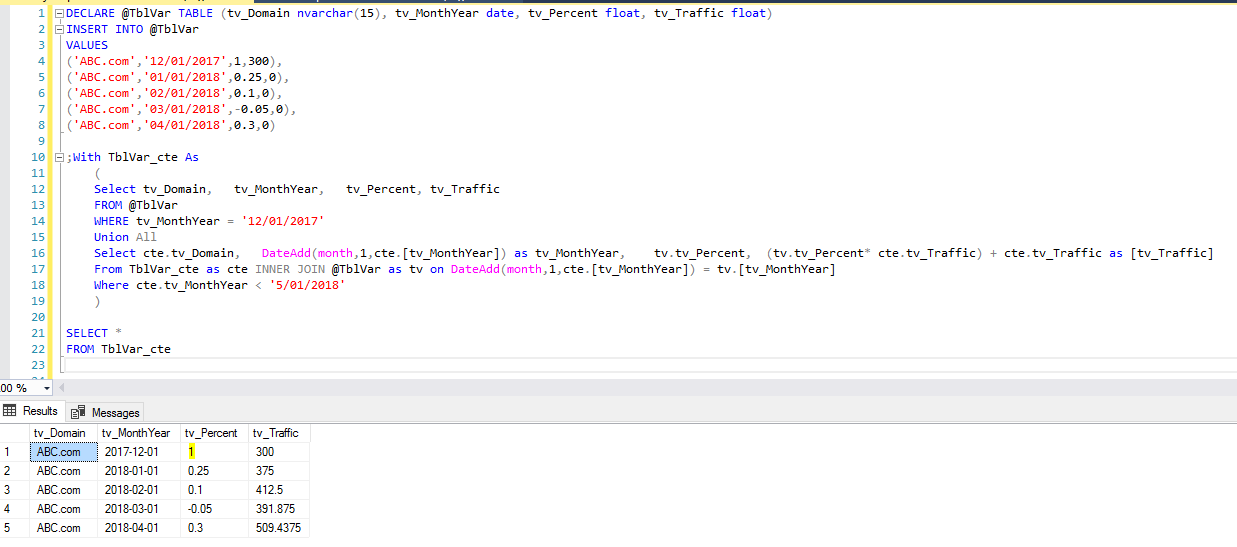
I have found that this type of problem lends itself nicely to a recursive solution. Unfortunately I have no clue how to code a recursive solution in QLIK so I typically do these operations in my load script. If you are pulling from a SQL Server database you could use TSQL code like the example below.
DECLARE @TblVar TABLE (tv_Domain nvarchar(15), tv_MonthYear date, tv_Percent float, tv_Traffic float)
INSERT INTO @TblVar
VALUES
('ABC.com','12/01/2017',1,300),
('ABC.com','01/01/2018',0.25,0),
('ABC.com','02/01/2018',0.1,0),
('ABC.com','03/01/2018',-0.05,0),
('ABC.com','04/01/2018',0.3,0)
;With TblVar_cte As
(
Select tv_Domain, tv_MonthYear, tv_Percent, tv_Traffic
FROM @TblVar
WHERE tv_MonthYear = '12/01/2017'
Union All
Select cte.tv_Domain, DateAdd(month,1,cte.[tv_MonthYear]) as tv_MonthYear, tv.tv_Percent, (tv.tv_Percent* cte.tv_Traffic) + cte.tv_Traffic as [tv_Traffic]
From TblVar_cte as cte INNER JOIN @TblVar as tv on DateAdd(month,1,cte.[tv_MonthYear]) = tv.[tv_MonthYear]
Where cte.tv_MonthYear < '5/01/2018'
)
SELECT *
FROM TblVar_cte
- Mark as New
- Bookmark
- Subscribe
- Mute
- Subscribe to RSS Feed
- Permalink
- Report Inappropriate Content
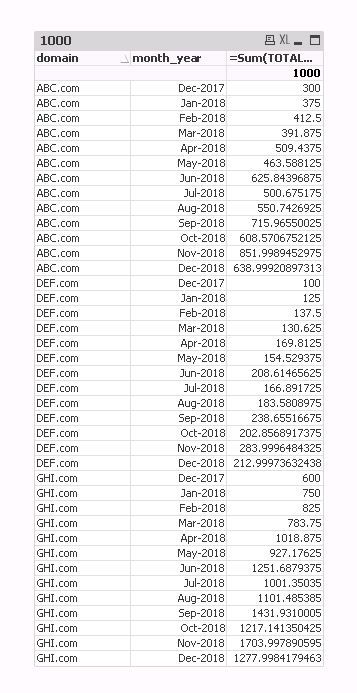
If you want to do this on the front end... you can try this
=Sum(TOTAL <domain> [actual traffic]) * exp(RangeSum(Above(Log(1+percentage), 0, RowNo())))
- Mark as New
- Bookmark
- Subscribe
- Mute
- Subscribe to RSS Feed
- Permalink
- Report Inappropriate Content
Sunny, that is a slick formula you came up with! Will the solution you posted above work in Qlik Sense as well?
- Mark as New
- Bookmark
- Subscribe
- Mute
- Subscribe to RSS Feed
- Permalink
- Report Inappropriate Content
It should, but need to make sure that the sorting is correct in the chart.... or alternatively dictate sorting using Aggr() function