Unlock a world of possibilities! Login now and discover the exclusive benefits awaiting you.
- Qlik Community
- :
- All Forums
- :
- QlikView App Dev
- :
- STACK chart it is possible to display only positve...
- Subscribe to RSS Feed
- Mark Topic as New
- Mark Topic as Read
- Float this Topic for Current User
- Bookmark
- Subscribe
- Mute
- Printer Friendly Page
- Mark as New
- Bookmark
- Subscribe
- Mute
- Subscribe to RSS Feed
- Permalink
- Report Inappropriate Content
STACK chart it is possible to display only positve value ?
Hi All,
my exp have positive value and negative value.
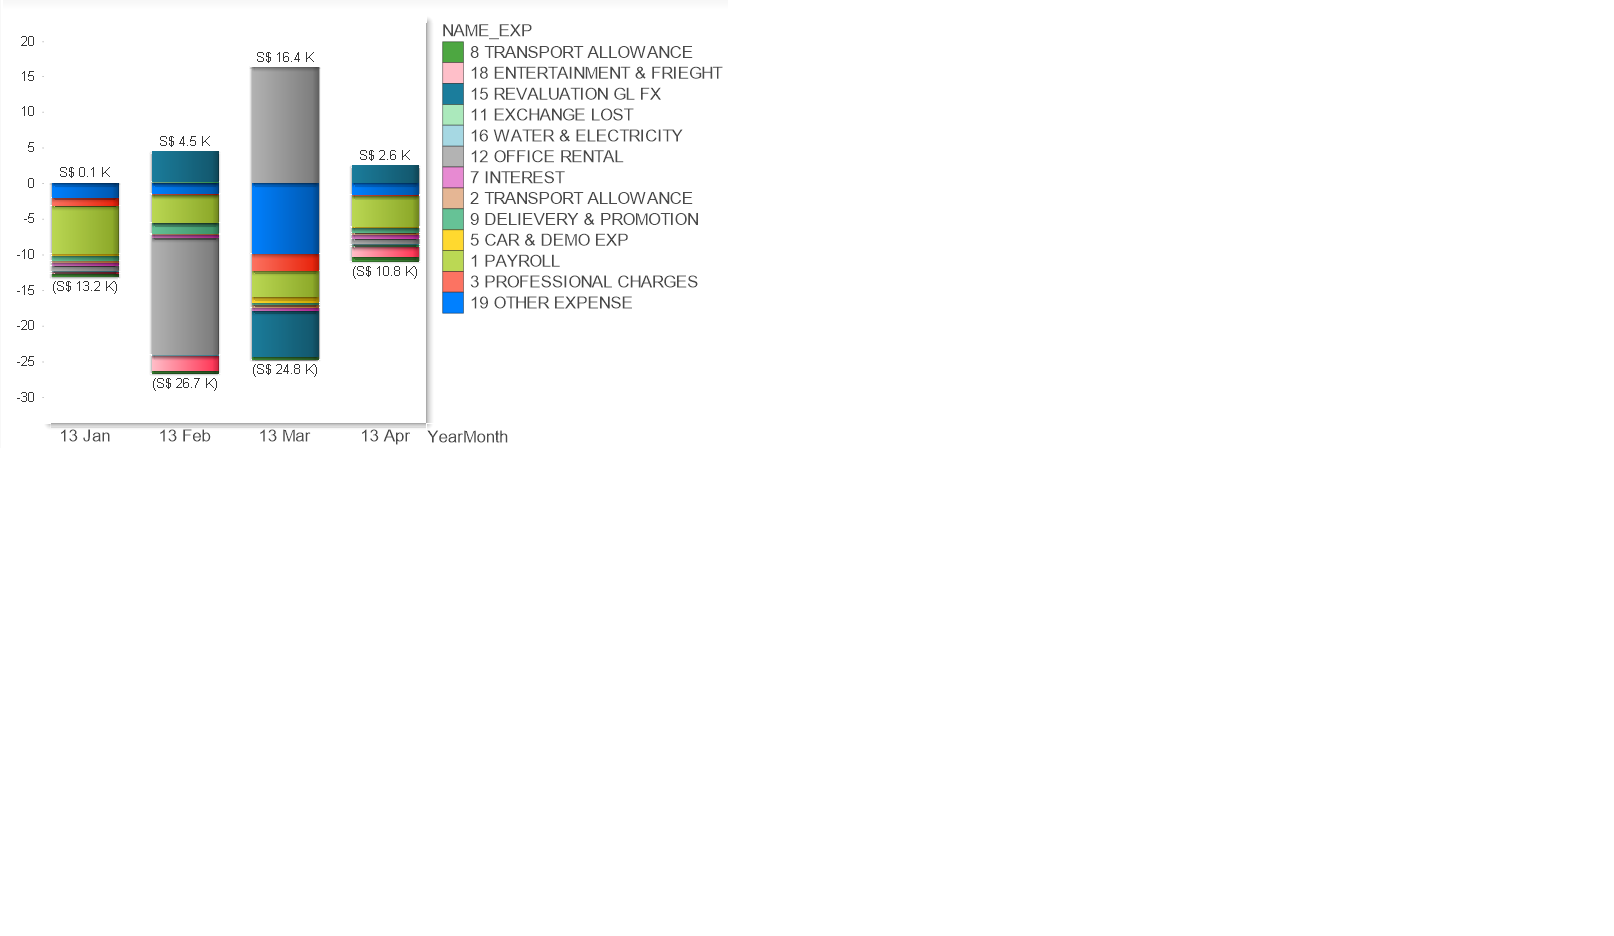
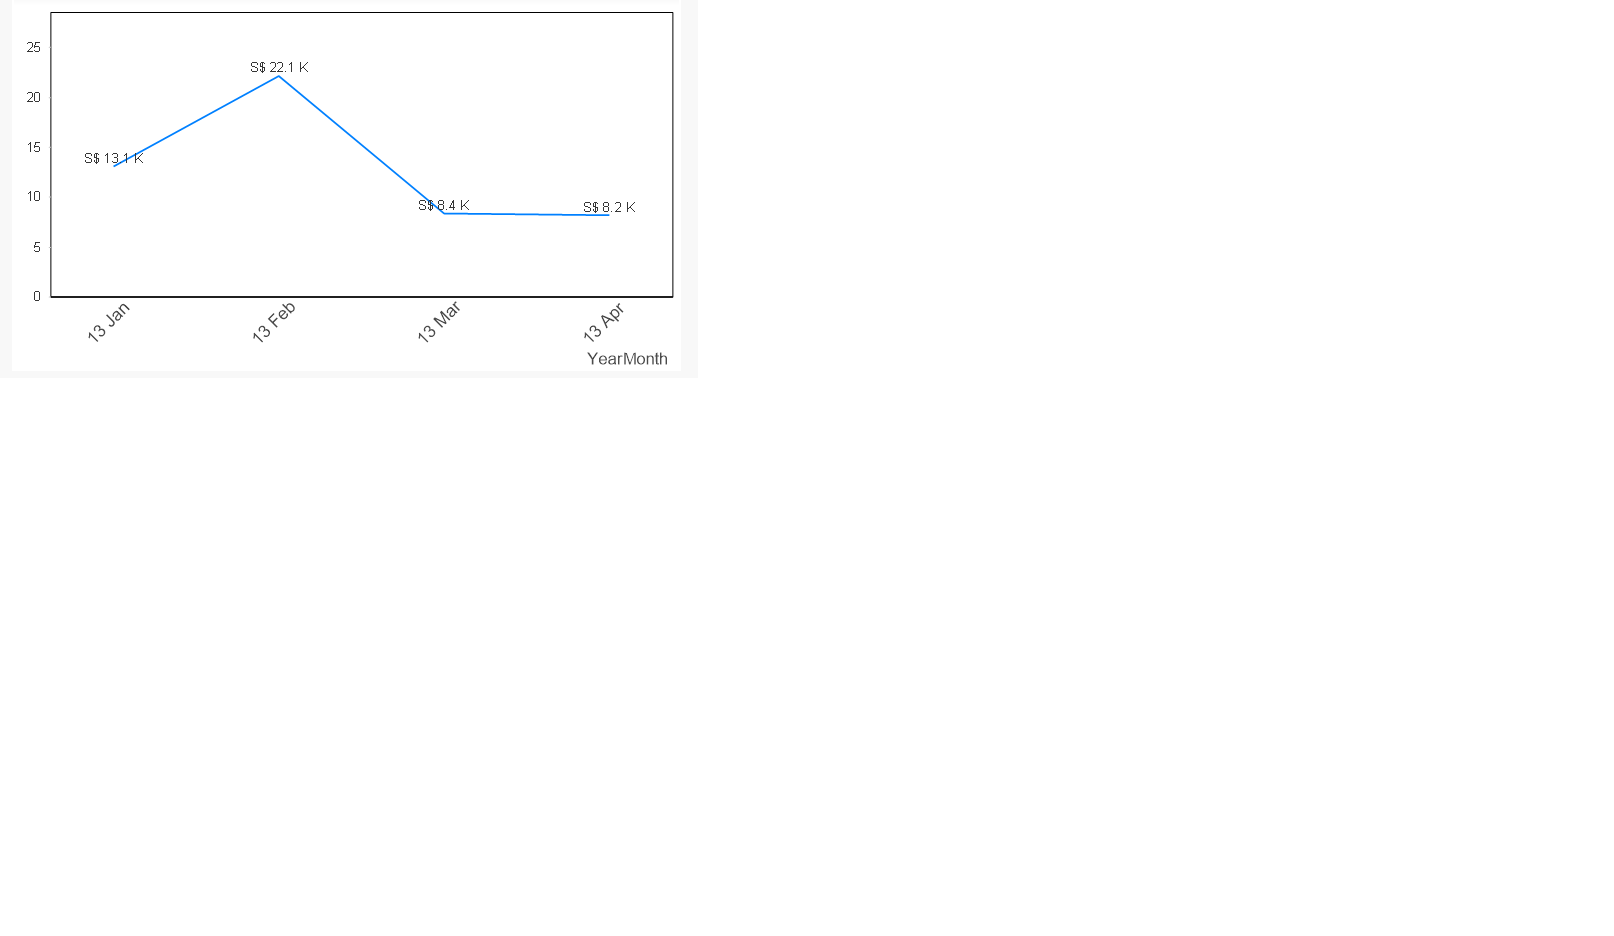
my stack chart have positive value and negative value , i wish to display the only result value ( see line chart below ), meaning the total amount same as my line chart , but display in stack chart. so i can view the total monthly expense by month using stack chart.

Below is the line chart which display the correct value . i need the line chart total amount , since it is correct , and add stack chart , since able stack chart have positive and negative value/

Both chart are correct , but i wish to make the stack appear in line chart. with out changing the line charge total amount , it is possible ?
- Mark as New
- Bookmark
- Subscribe
- Mute
- Subscribe to RSS Feed
- Permalink
- Report Inappropriate Content
Looking at your stacked bar chart, the total amount per bar would be negative, correct? So I don't understand the values shown in your line chart.
Besides this, how do you want to show the distibution of positive and negative values in the new chart, resulting in something comparable to the line chart total amount? Could you post a sketch drawing how that should look like?
- Mark as New
- Bookmark
- Subscribe
- Mute
- Subscribe to RSS Feed
- Permalink
- Report Inappropriate Content
Hi swuehl
i use fabs for line chart. to make it shows +ve.
money(
fabs(
sum({$<year = {$(=max(year))}
,NAME_PNL = {"4 EXP"}
, month = {"<=$(=max({<year={$(=max(year))}>} month))"}>}Amount/$(ColumnDim98))/1000
)
, $(vMoneyFormatK_GL))
your second question make realise it is not possible. unless you are magician.
thank.