Unlock a world of possibilities! Login now and discover the exclusive benefits awaiting you.
- Qlik Community
- :
- All Forums
- :
- QlikView App Dev
- :
- STATIC LINE STYLE IN LINE CHART
- Subscribe to RSS Feed
- Mark Topic as New
- Mark Topic as Read
- Float this Topic for Current User
- Bookmark
- Subscribe
- Mute
- Printer Friendly Page
- Mark as New
- Bookmark
- Subscribe
- Mute
- Subscribe to RSS Feed
- Permalink
- Report Inappropriate Content
STATIC LINE STYLE IN LINE CHART
Hi All,
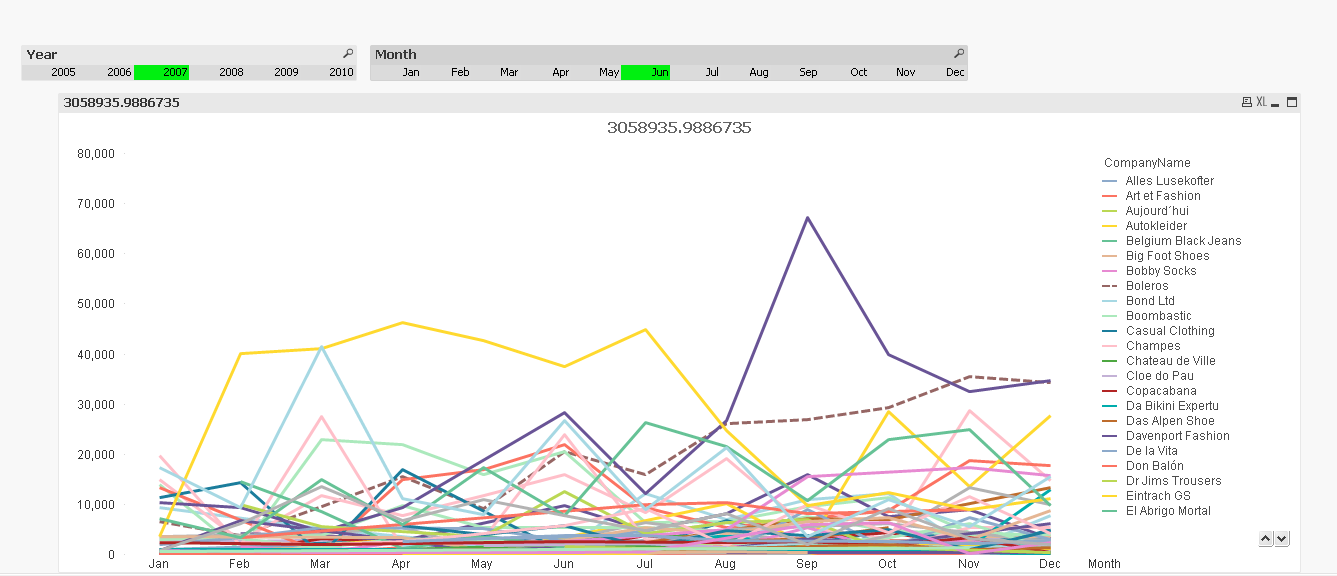
I have a line chart in which I am showing sale of different brands per month for different companies.
I need to highlight one of the company with a different line style and color.
For this I added Month and Company as dimension and expression: Sum({<Month>}Sales) since I want to show all month's sale even if the month is selected. I get the correct data as output.
I also had expression for the color and style as : If(CompanyName='XYX',RGB(150,102)) and if(Compan yName='XYZ','<S2,W1>')
When I dont select any month, I have the output as given in the picture.

But when I select a Month, The style and color is applied only for that particular month as shown below.
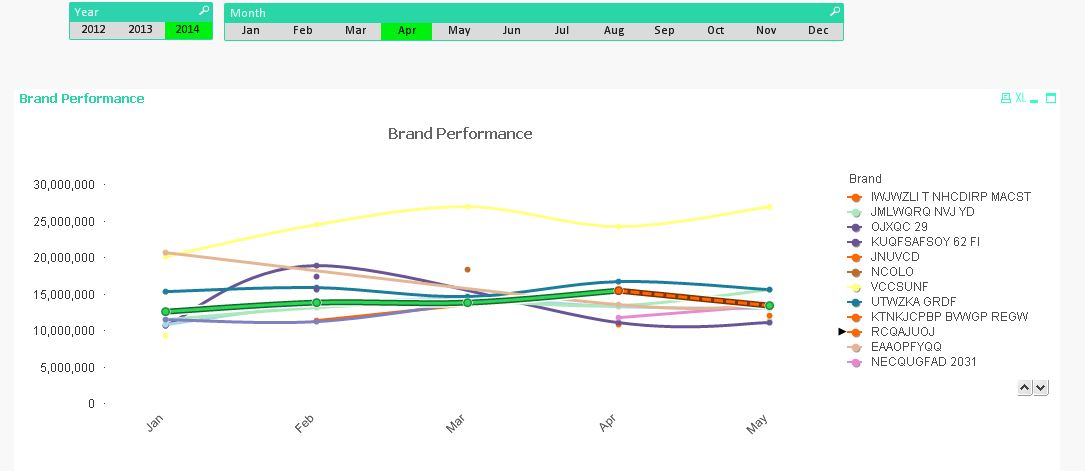
Here when apr is seleted, line from Apr to May is shown in the style whereas rest data is shown in green color.
I need the first output to be shown even if the month is selected.
If you could please help me to make the style and color independent of selection, would be a appreciated.
Thanks.
- Tags:
- line_charts
Accepted Solutions
- Mark as New
- Bookmark
- Subscribe
- Mute
- Subscribe to RSS Feed
- Permalink
- Report Inappropriate Content
Hi Deepak,
You can use this in expression for color and style
=If(only({<Month>}CompanyName='XYZ'),RGB(150,102,100))
=if(only({<Month>}CompanyName='XYZ'),'<S2,W1>')
- Mark as New
- Bookmark
- Subscribe
- Mute
- Subscribe to RSS Feed
- Permalink
- Report Inappropriate Content
Hi,
Use this expression
style =if(only({<Month>}CompanyName='XYX') ,'<S2,W1>')
color =if(only({<Month>}CompanyName='XYX') ,Rgb(150,102))
- Mark as New
- Bookmark
- Subscribe
- Mute
- Subscribe to RSS Feed
- Permalink
- Report Inappropriate Content
Hi Deepak,
You can use this in expression for color and style
=If(only({<Month>}CompanyName='XYZ'),RGB(150,102,100))
=if(only({<Month>}CompanyName='XYZ'),'<S2,W1>')